Competitor AI Dashboard
Client
Celonis
Role
UX/UI Designer, Product Engineer
Duration
3 Months
Techstack
Request
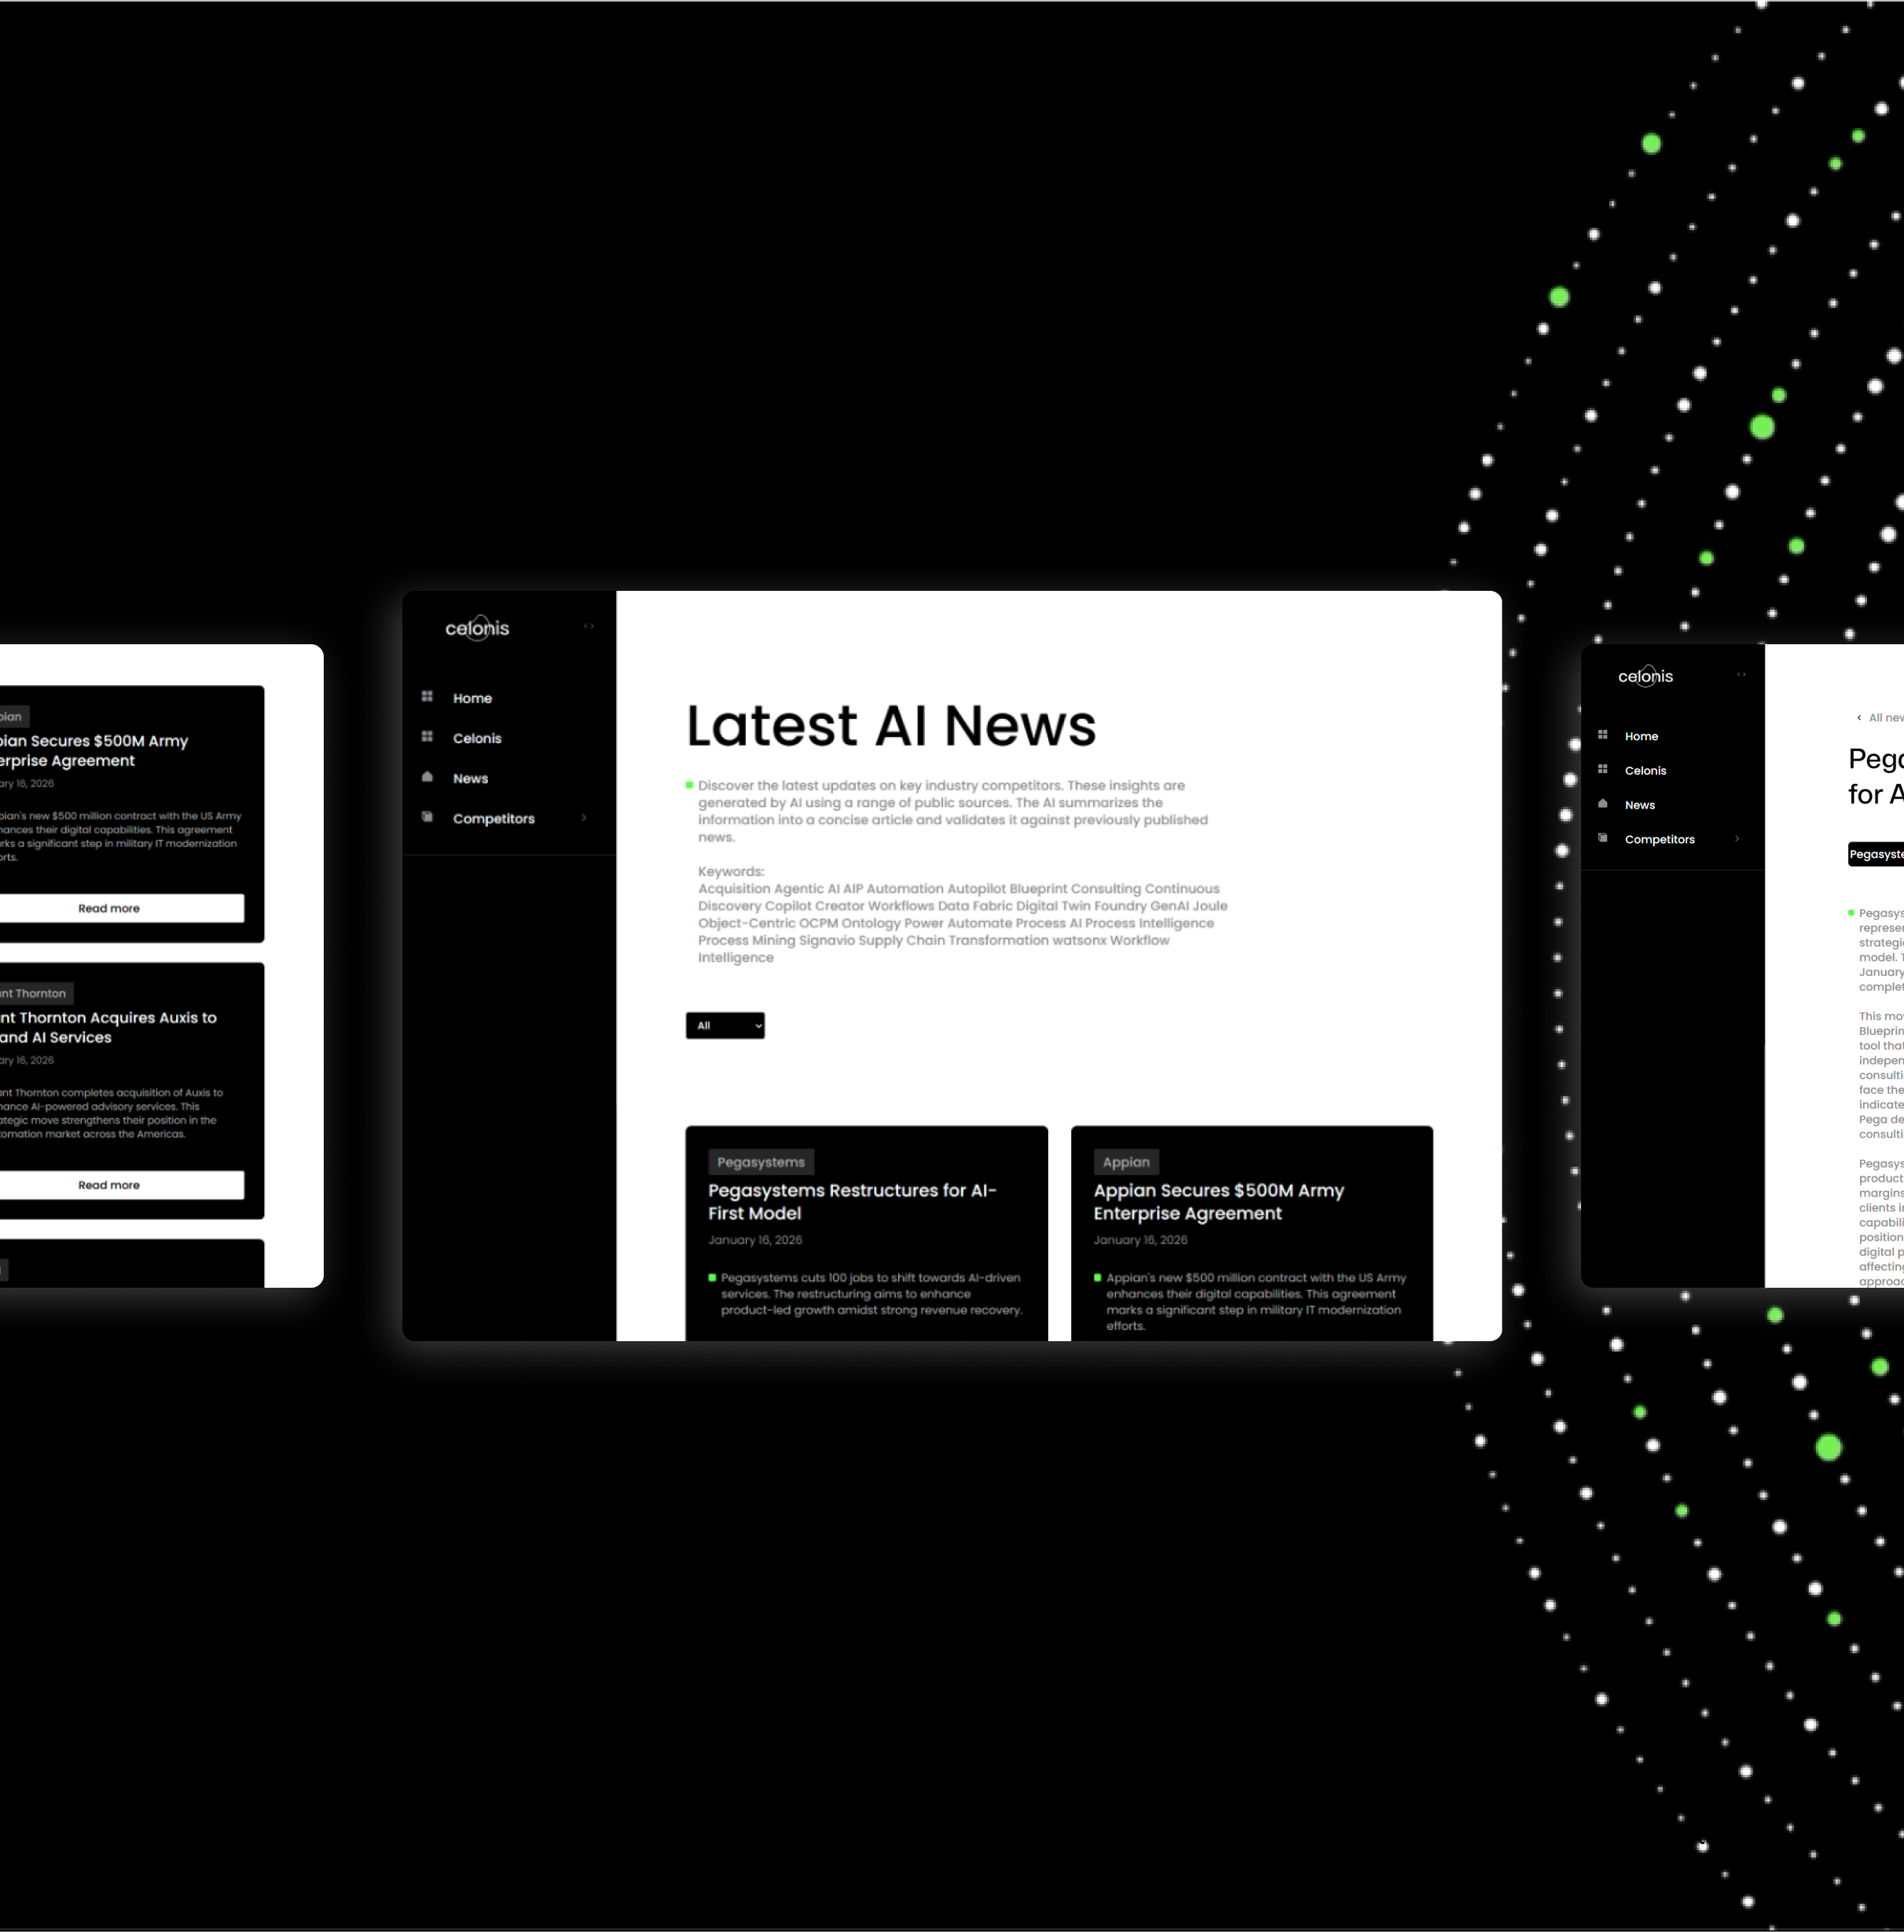
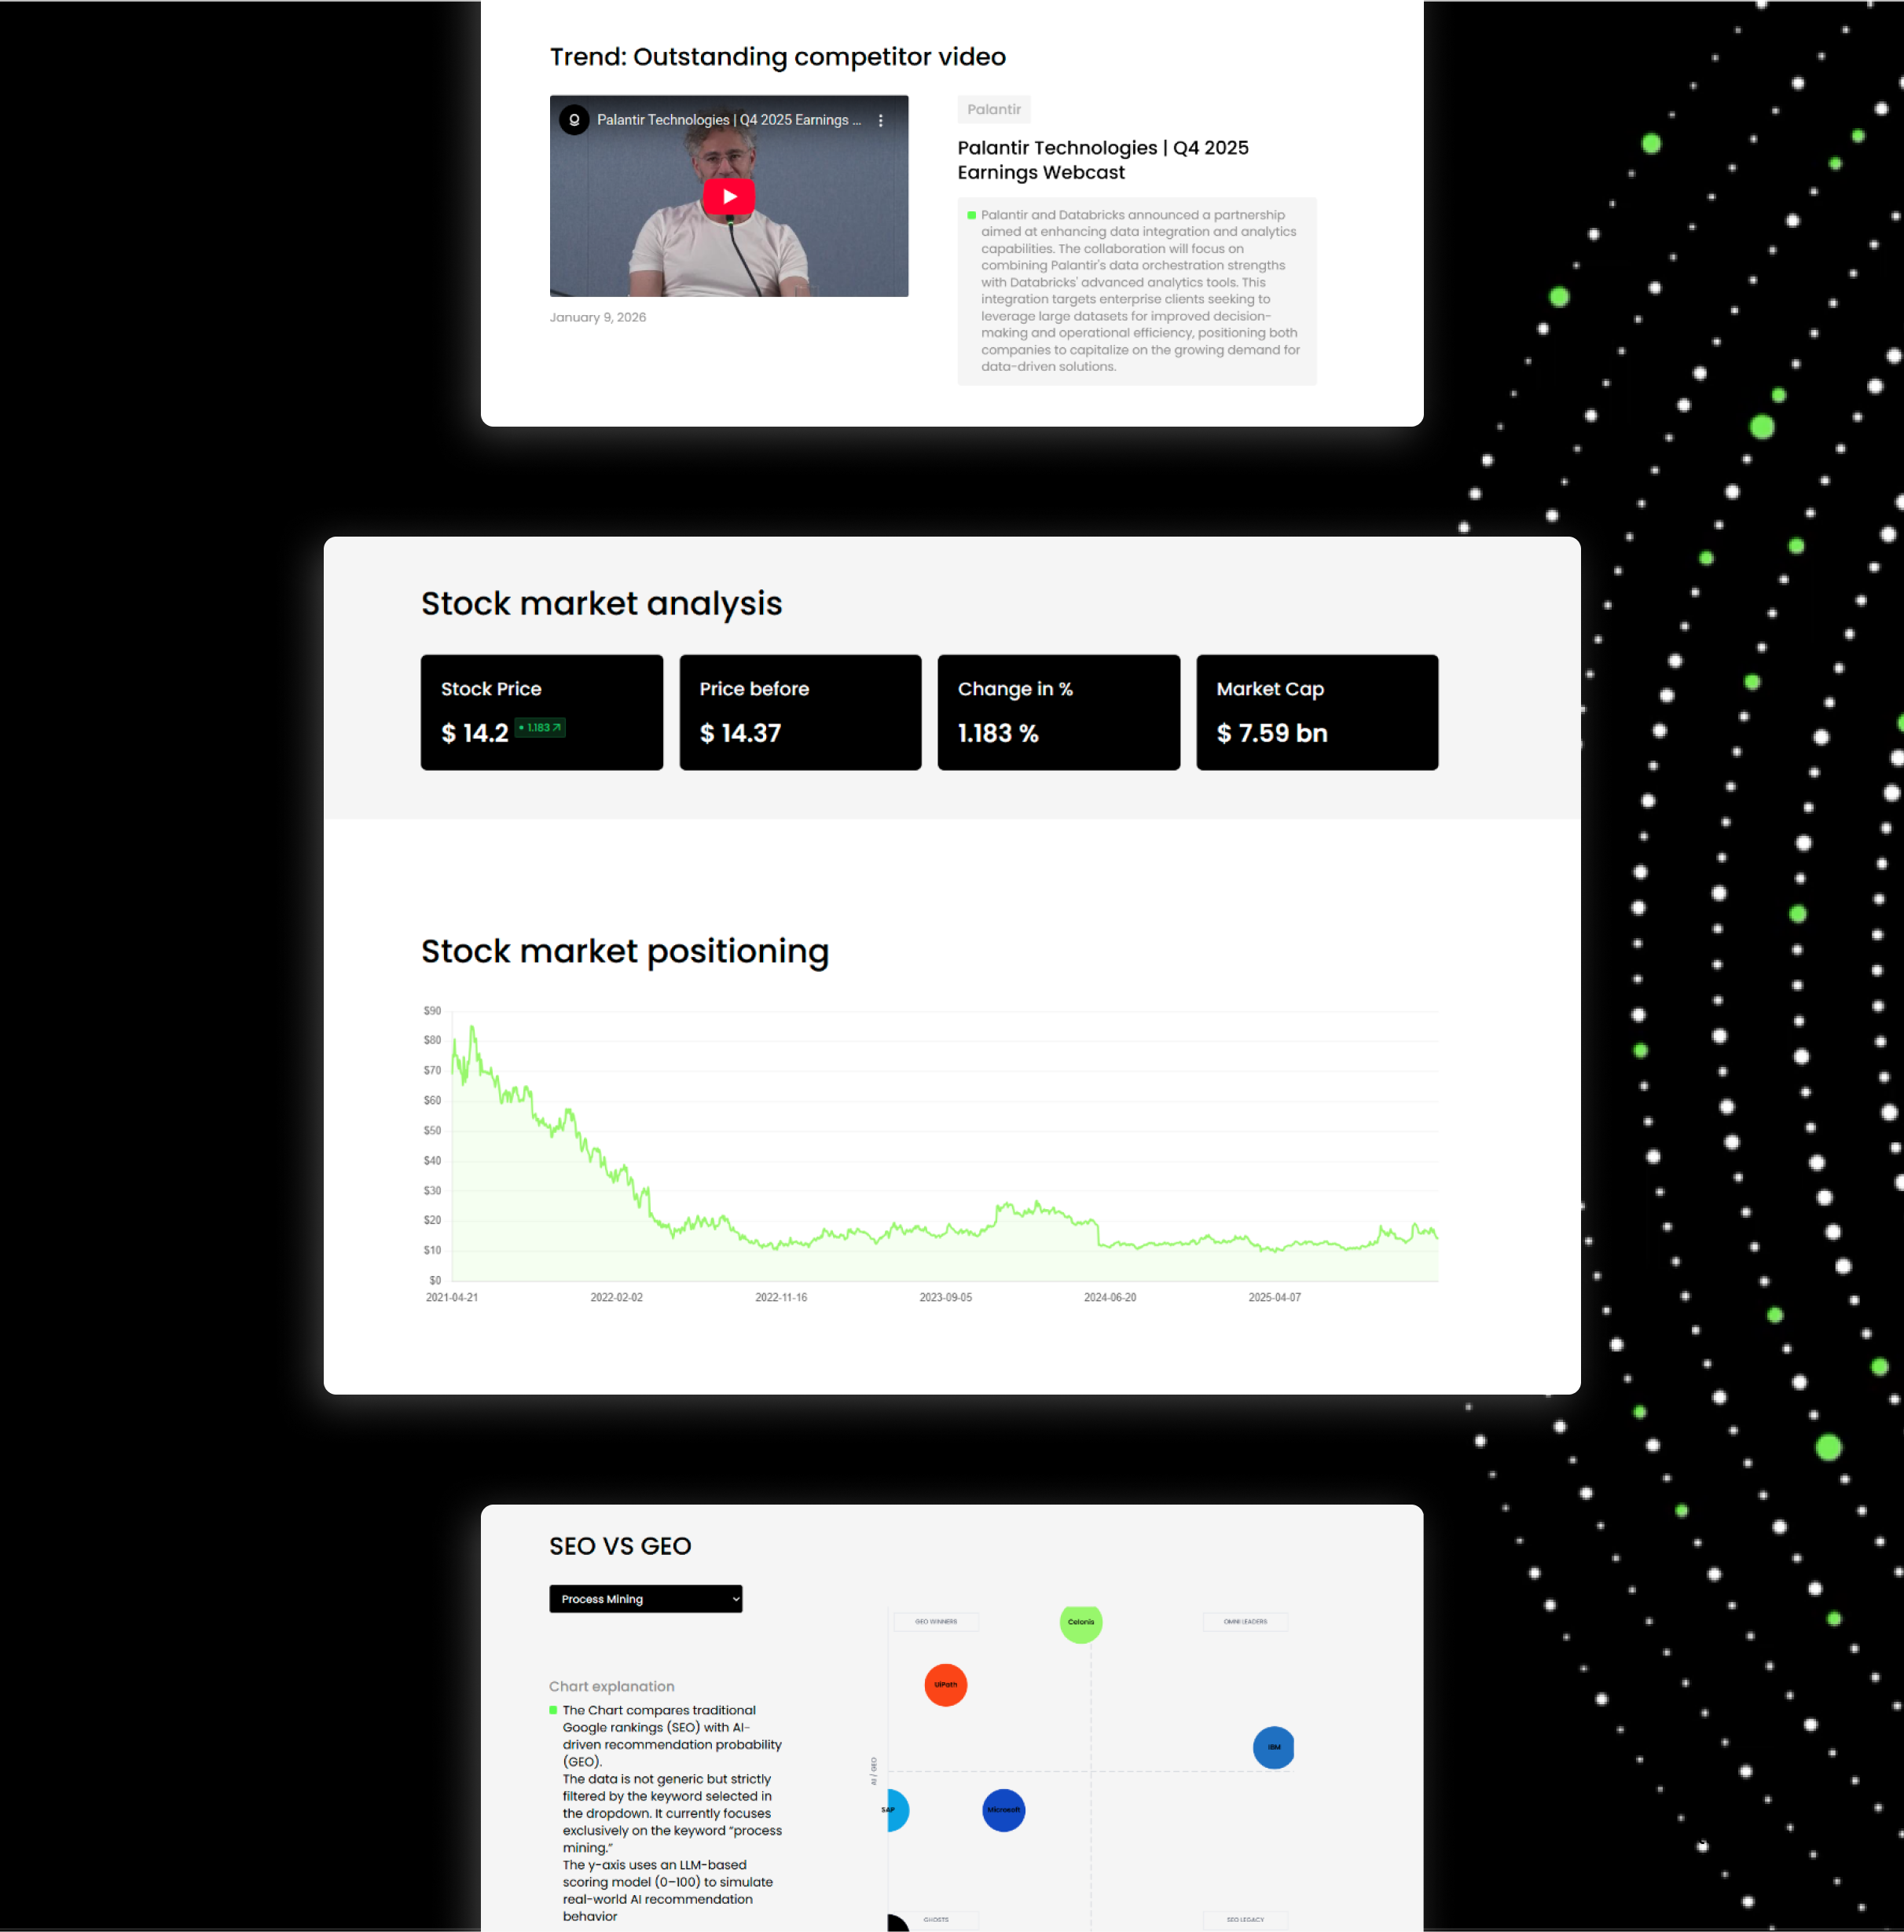
An AI-powered assistant acting as a Junior Brand Intelligence Analyst—designed as a live, conversational dashboard that continuously tracks, analyzes, and distills competitor brand activity across digital channels into clear, actionable insights, while also offering a chatbot interface that allows users to ask questions and receive instant, data-driven responses.
challenges
ideation
approach
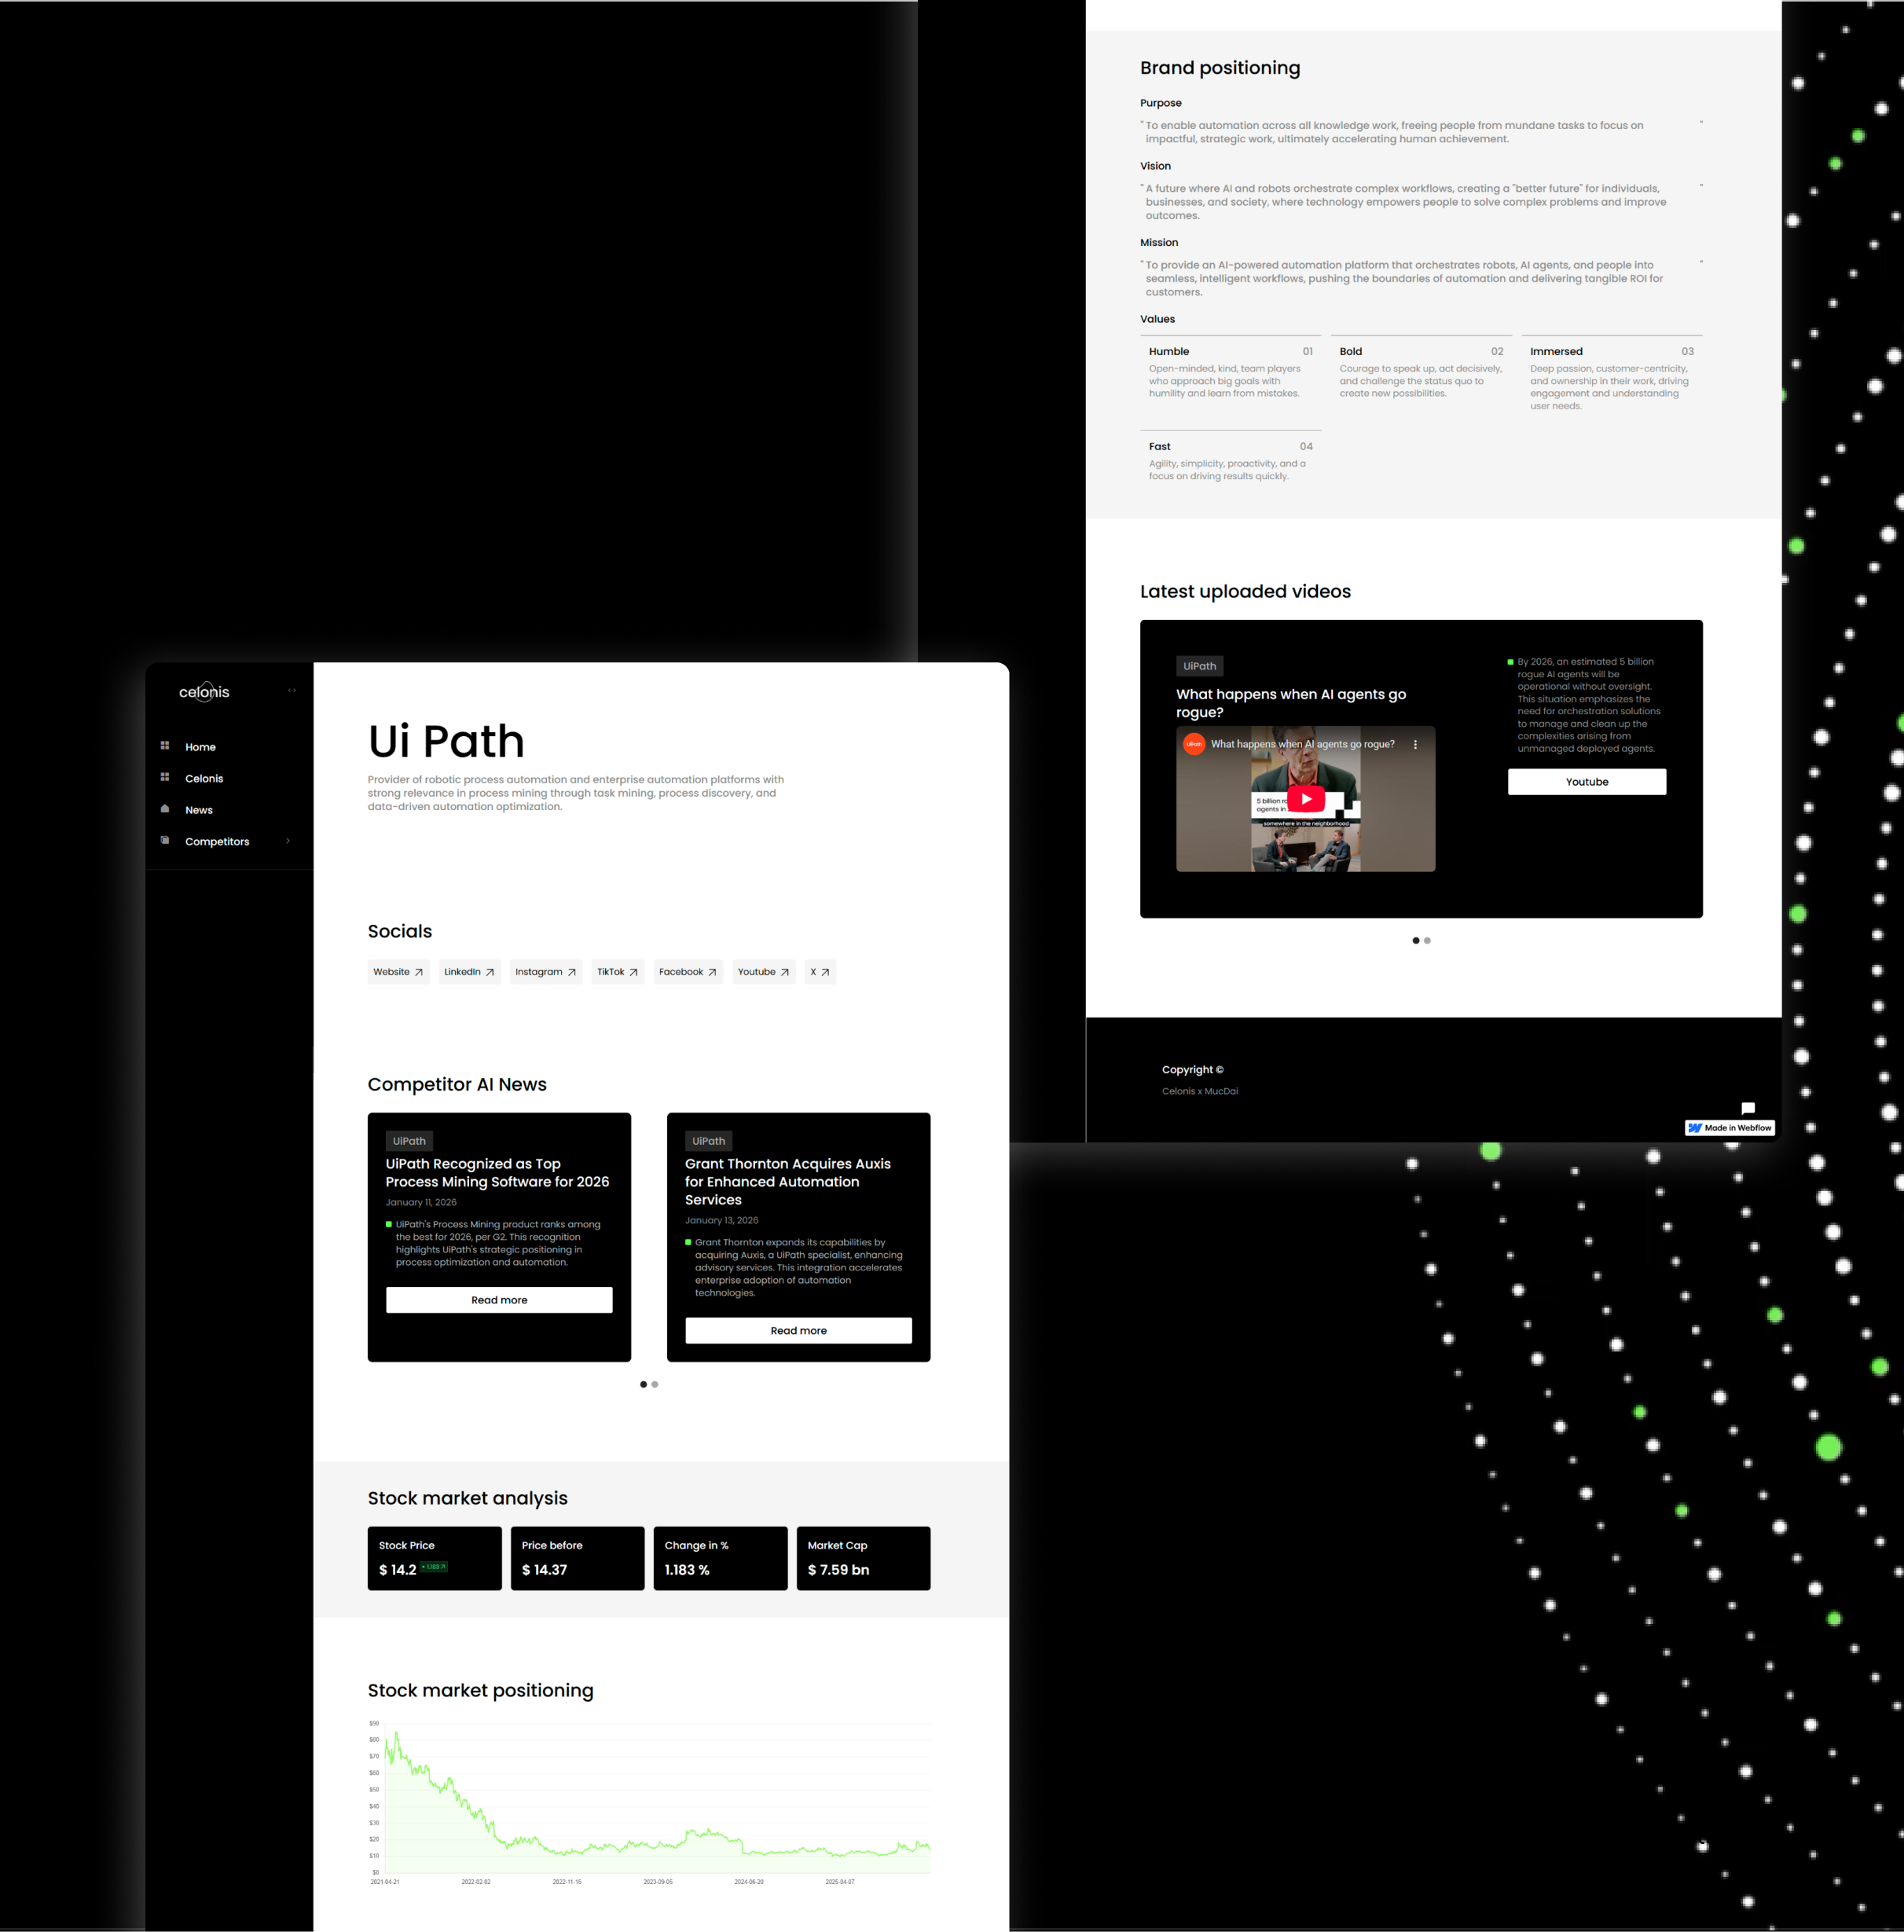
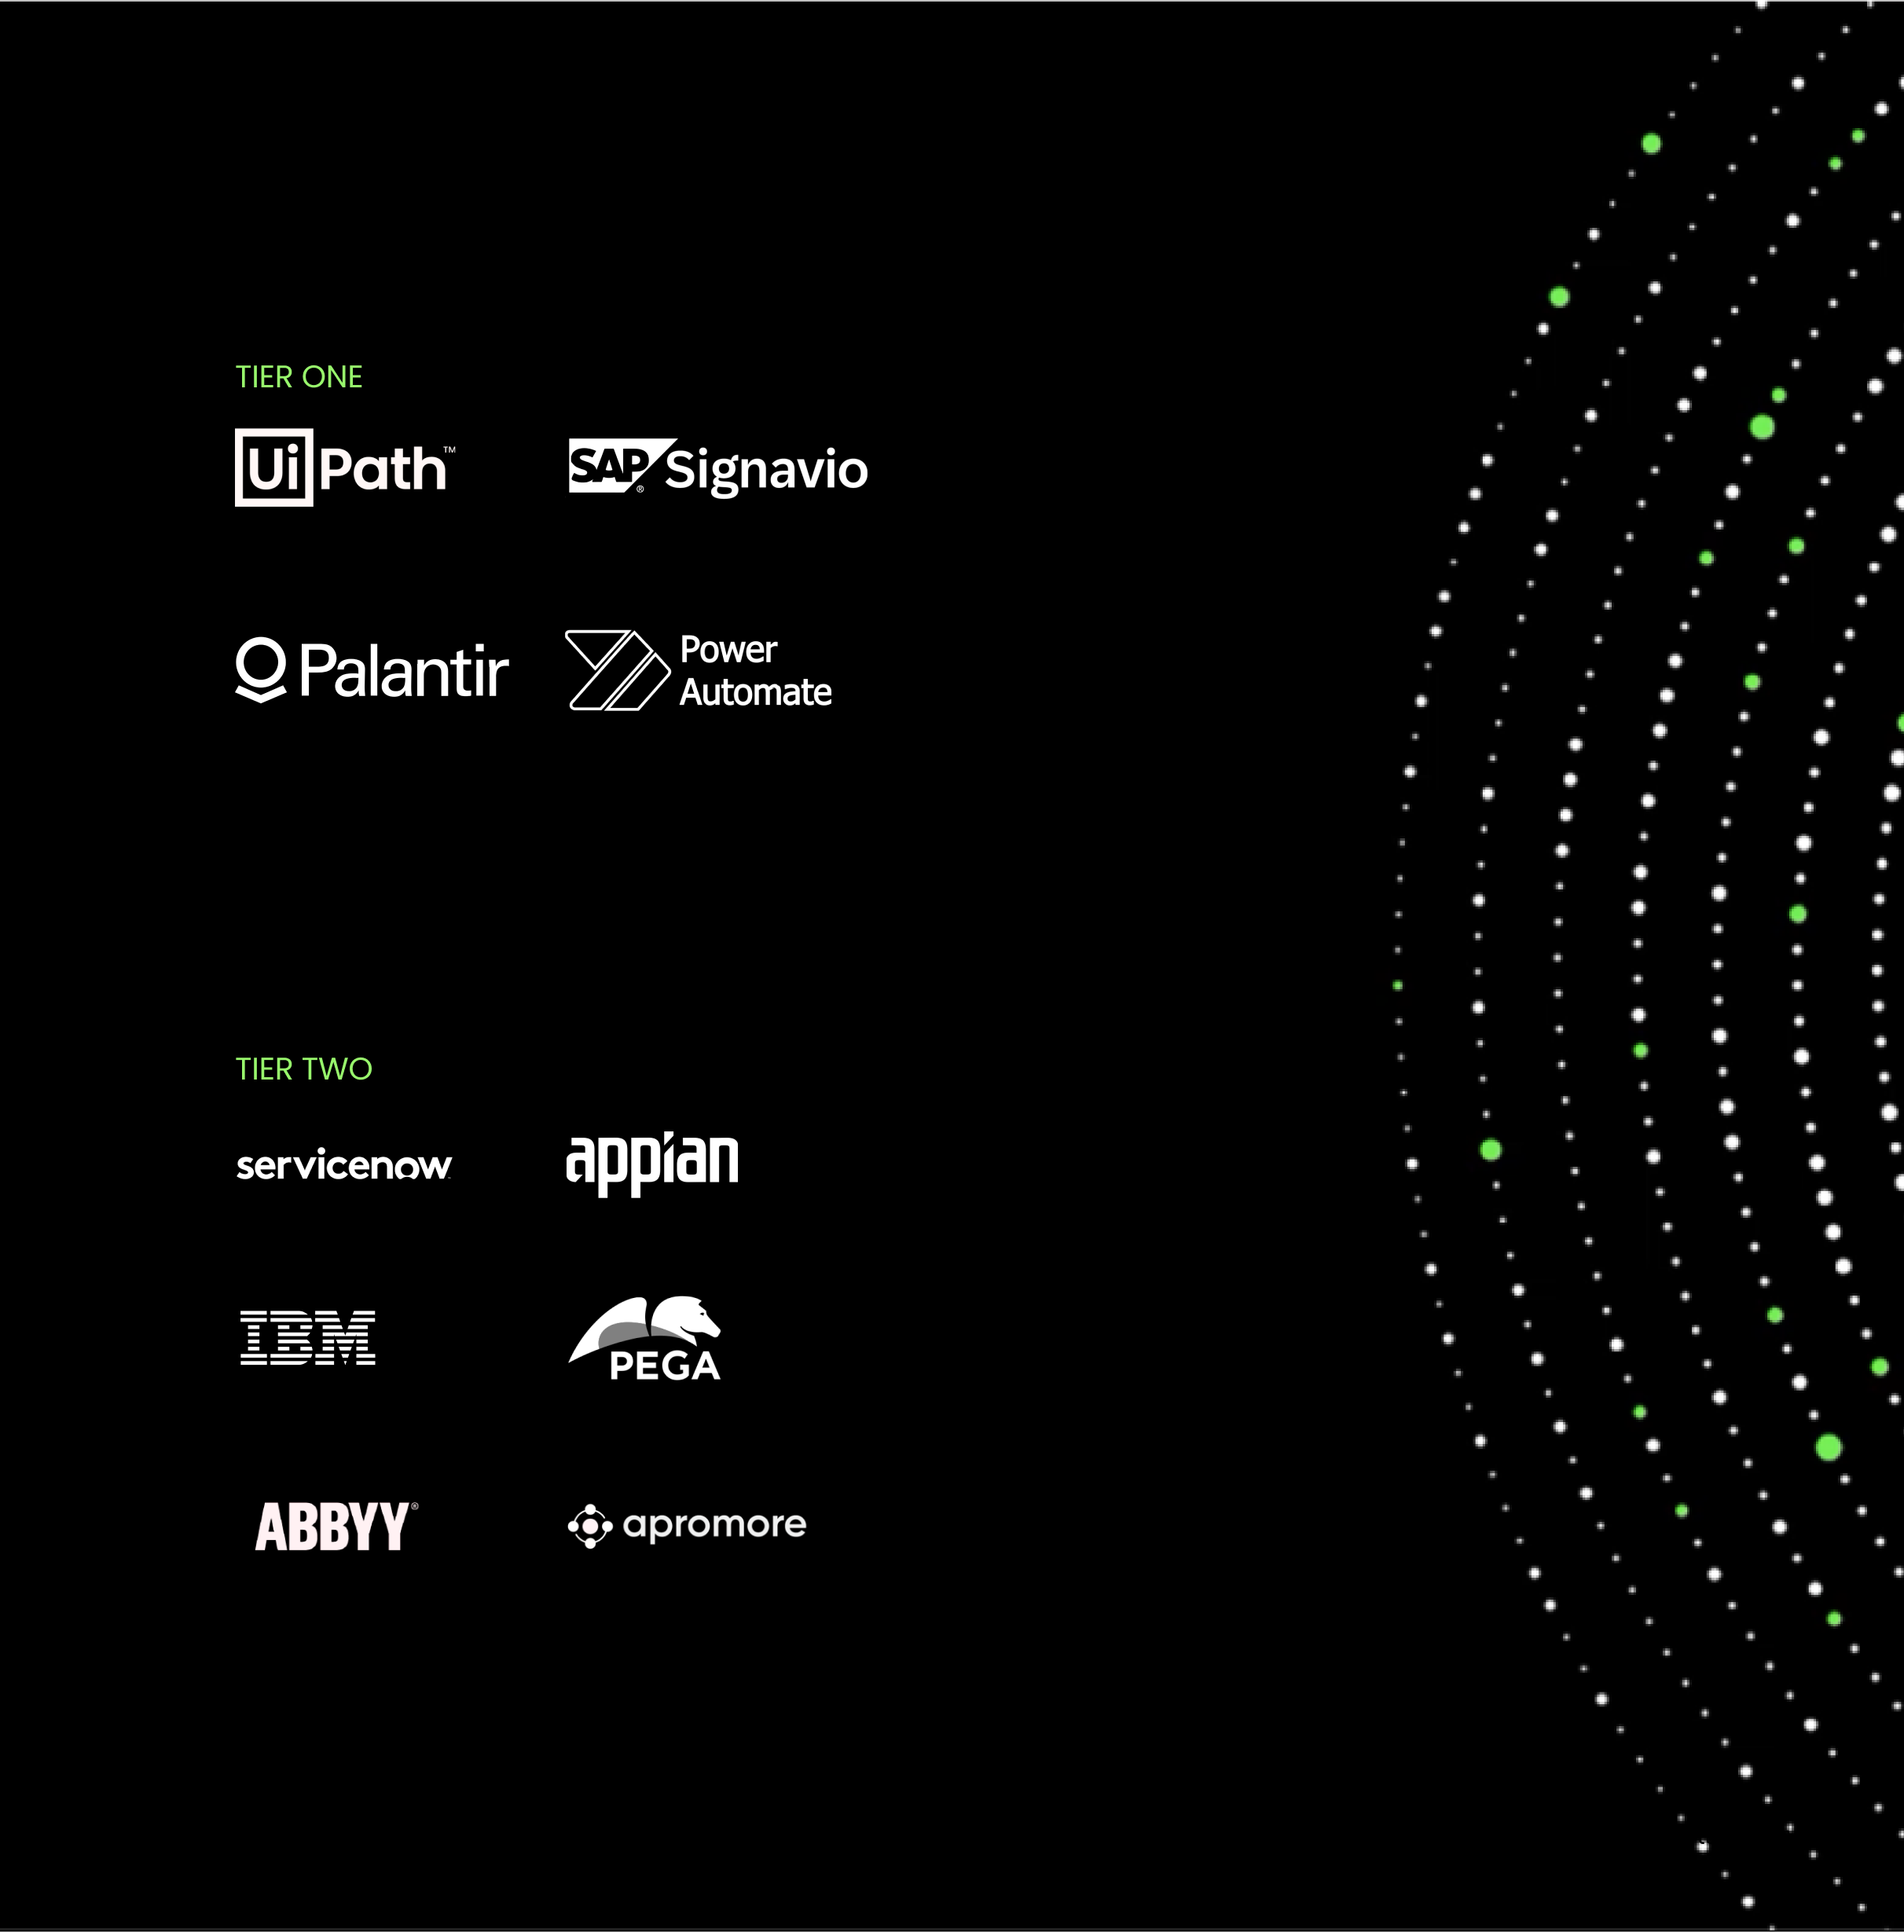
We began by identifying and structuring all relevant data topics. In parallel, we researched which types of public competitor data are readily accessible and analyzed common sources that could later be used consistently across all competitors. We also tested various AI tools to evaluate their outputs for the competitor data we were seeking. Through our research, we learned that prioritizing quality over quantity was most effective. We initially focused on quantitative data, publicly accessible competitor information, and AI-generated news.
approach
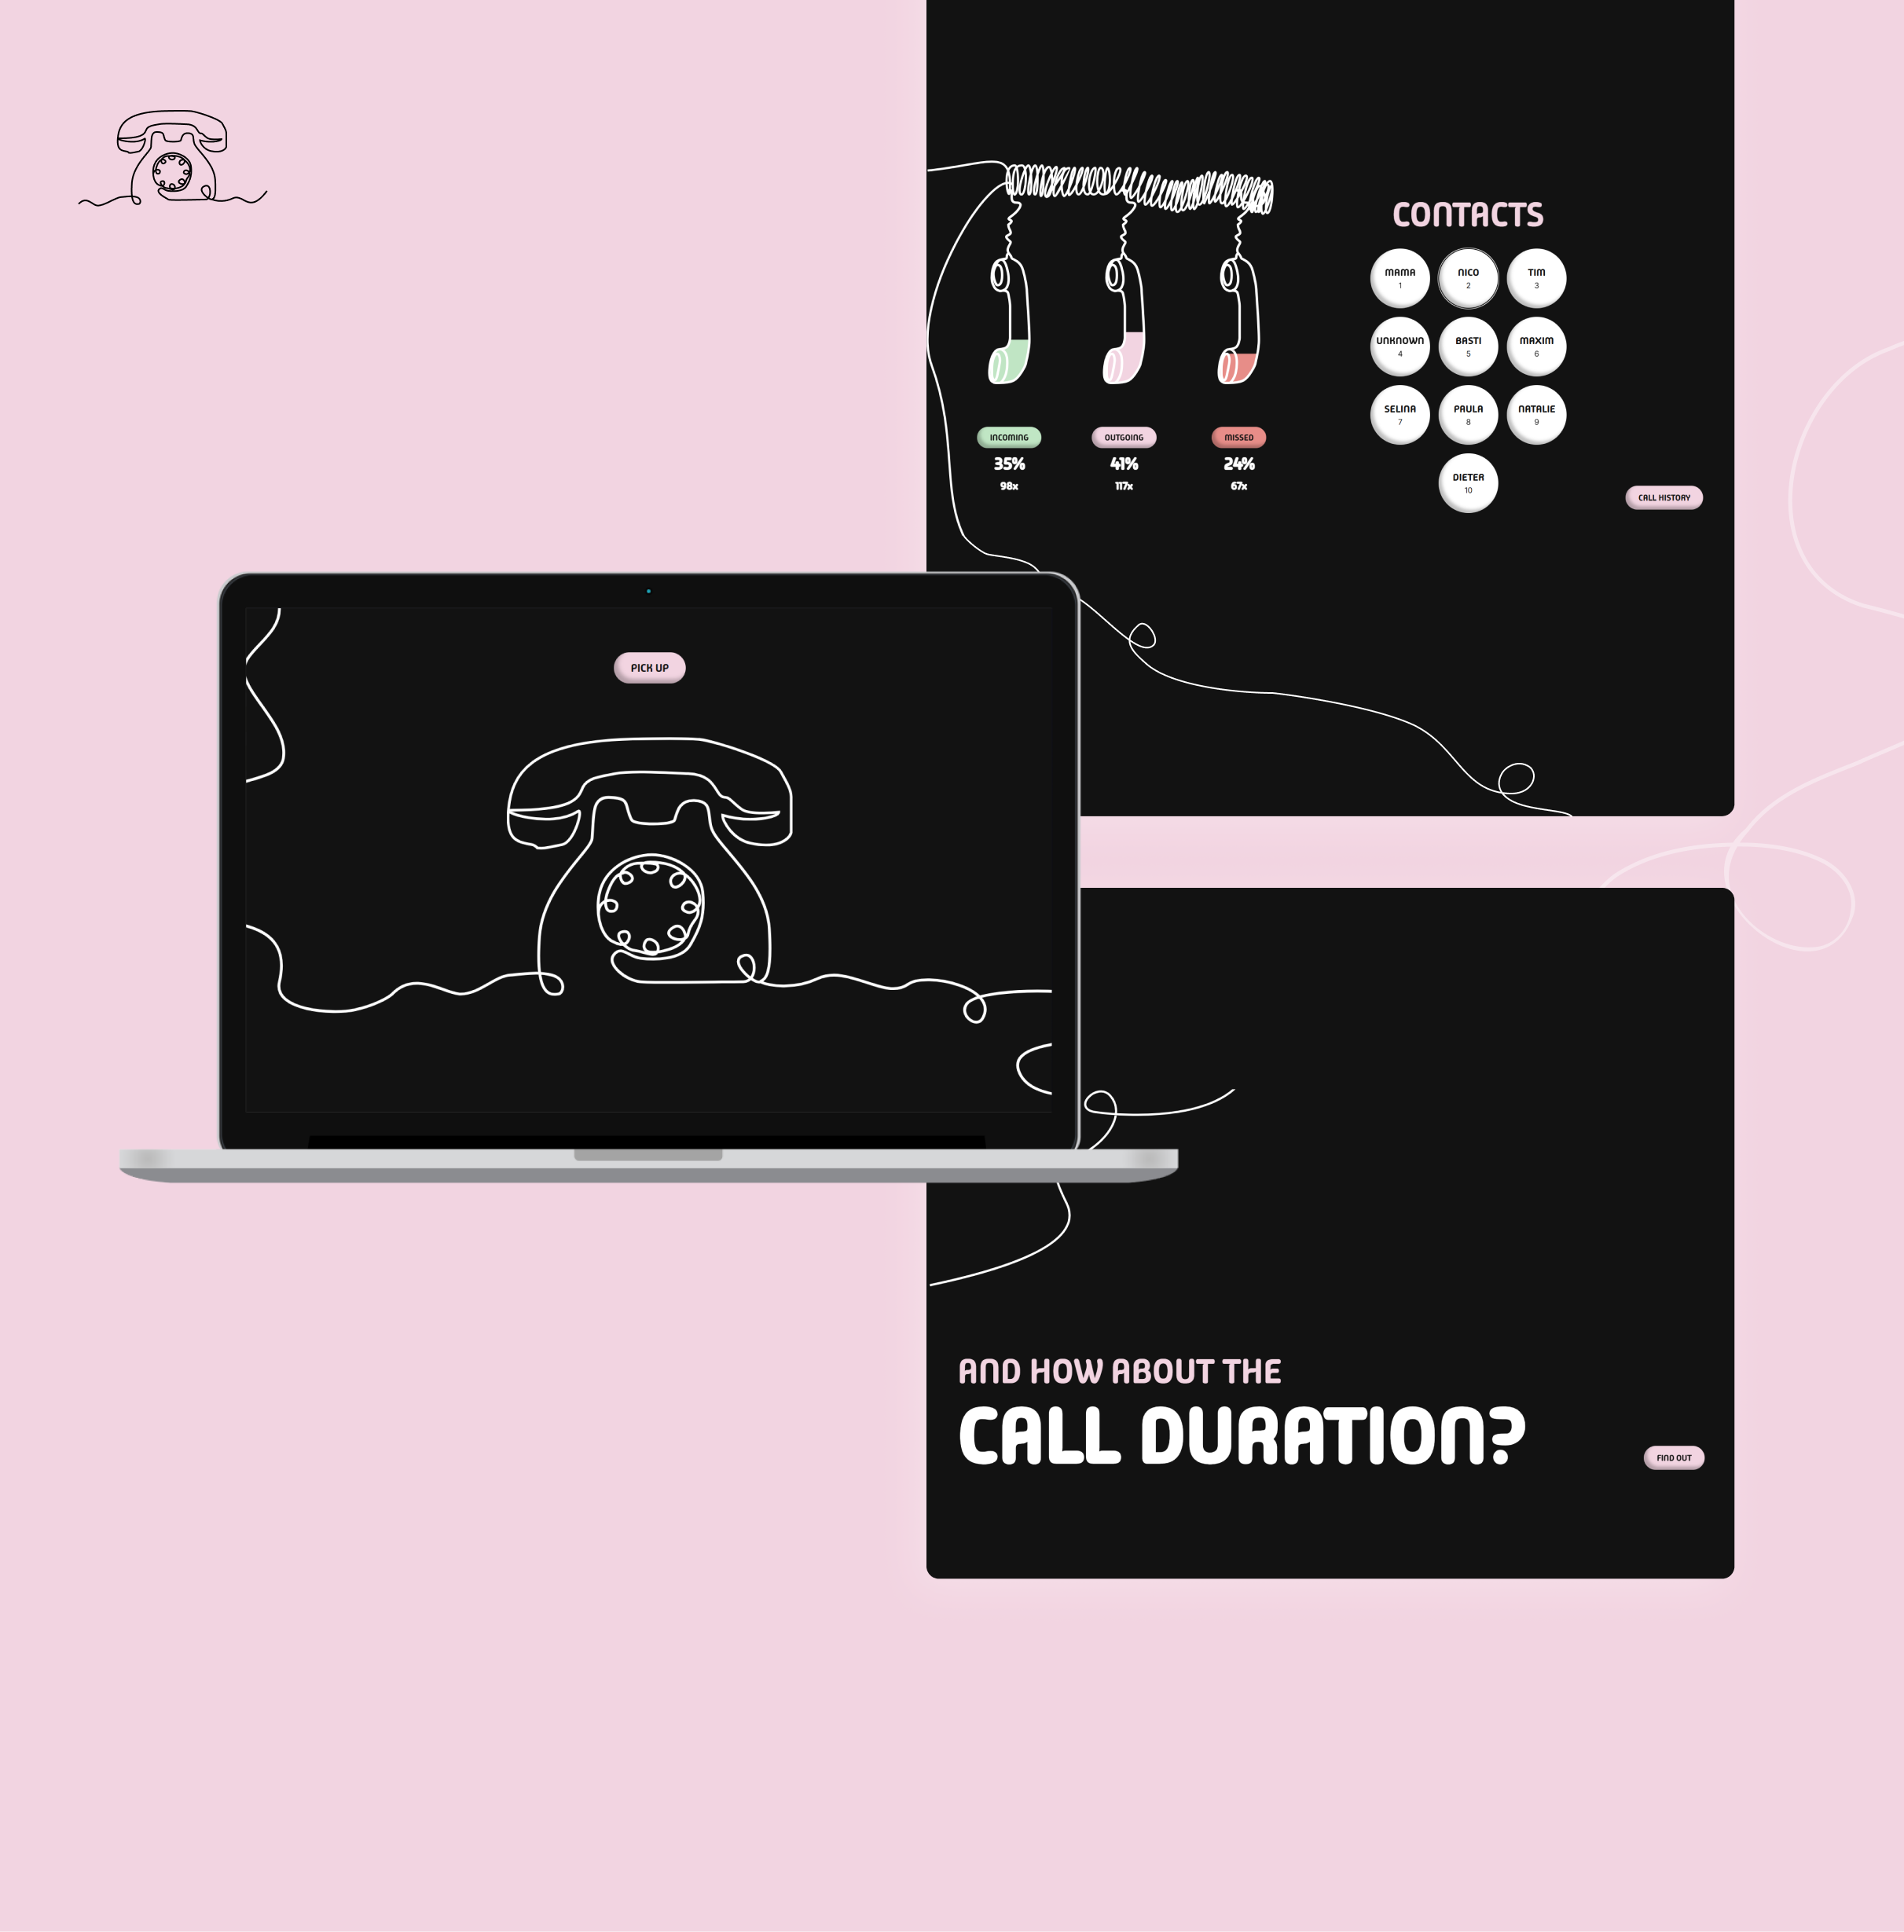
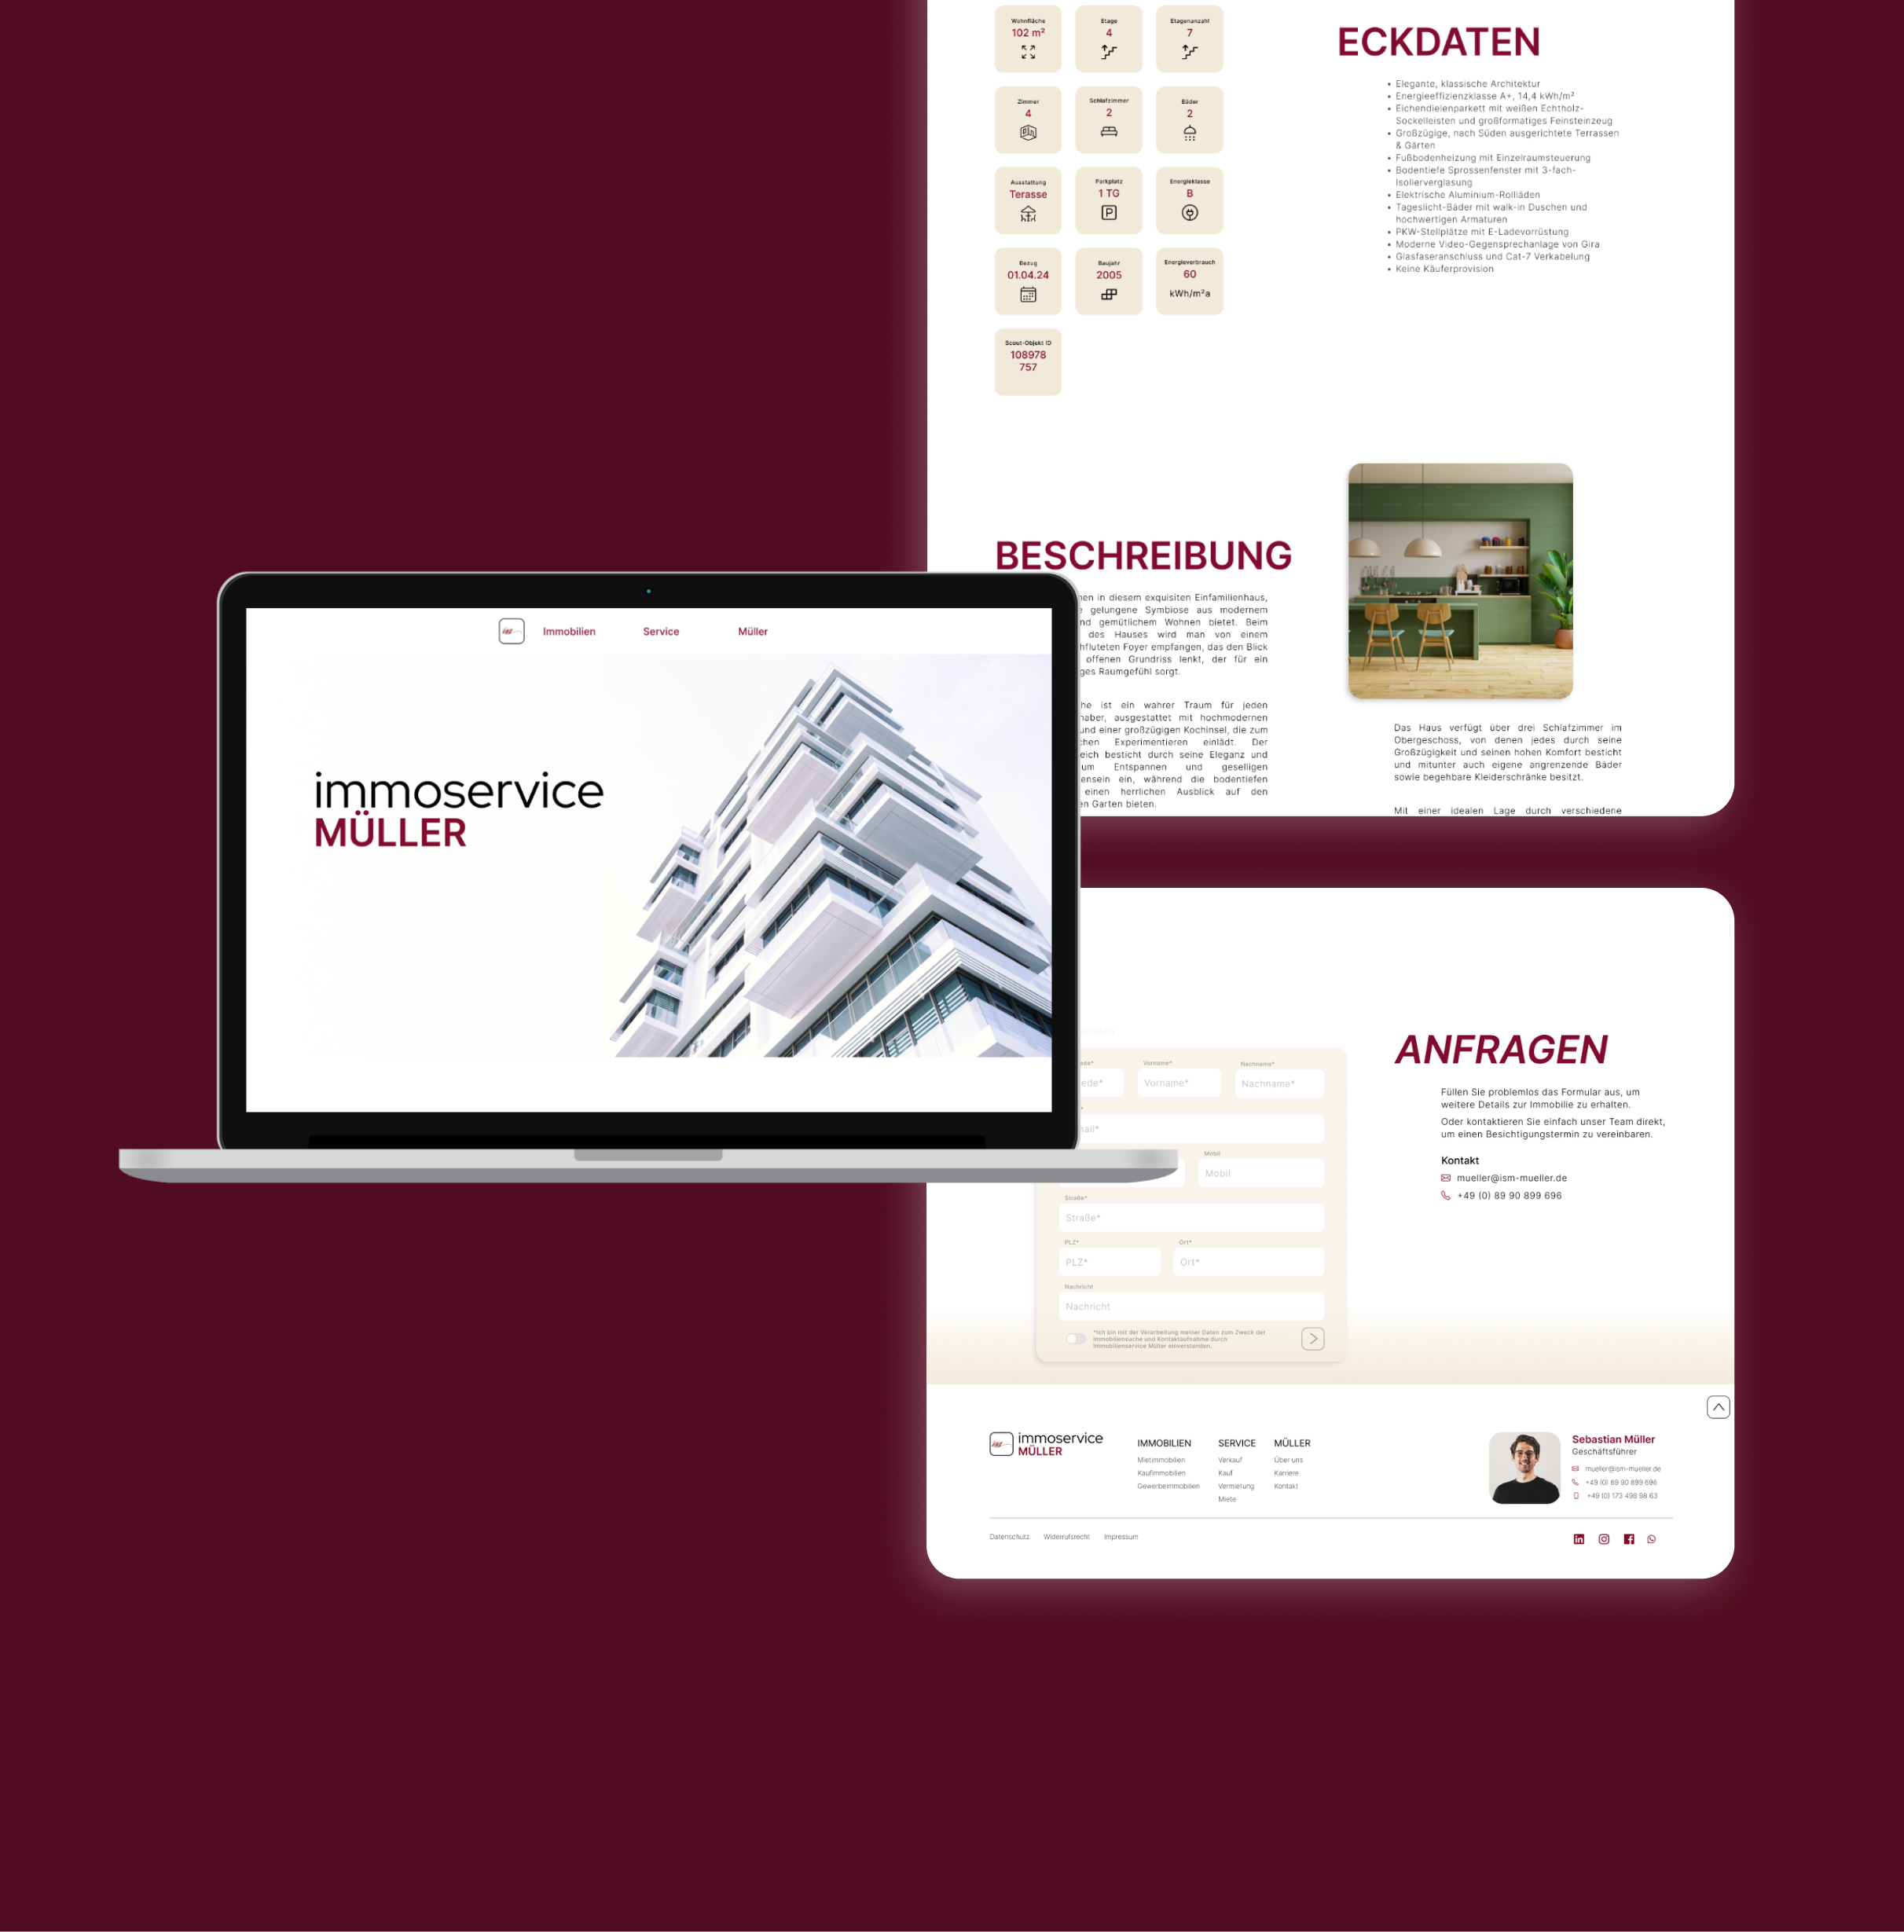
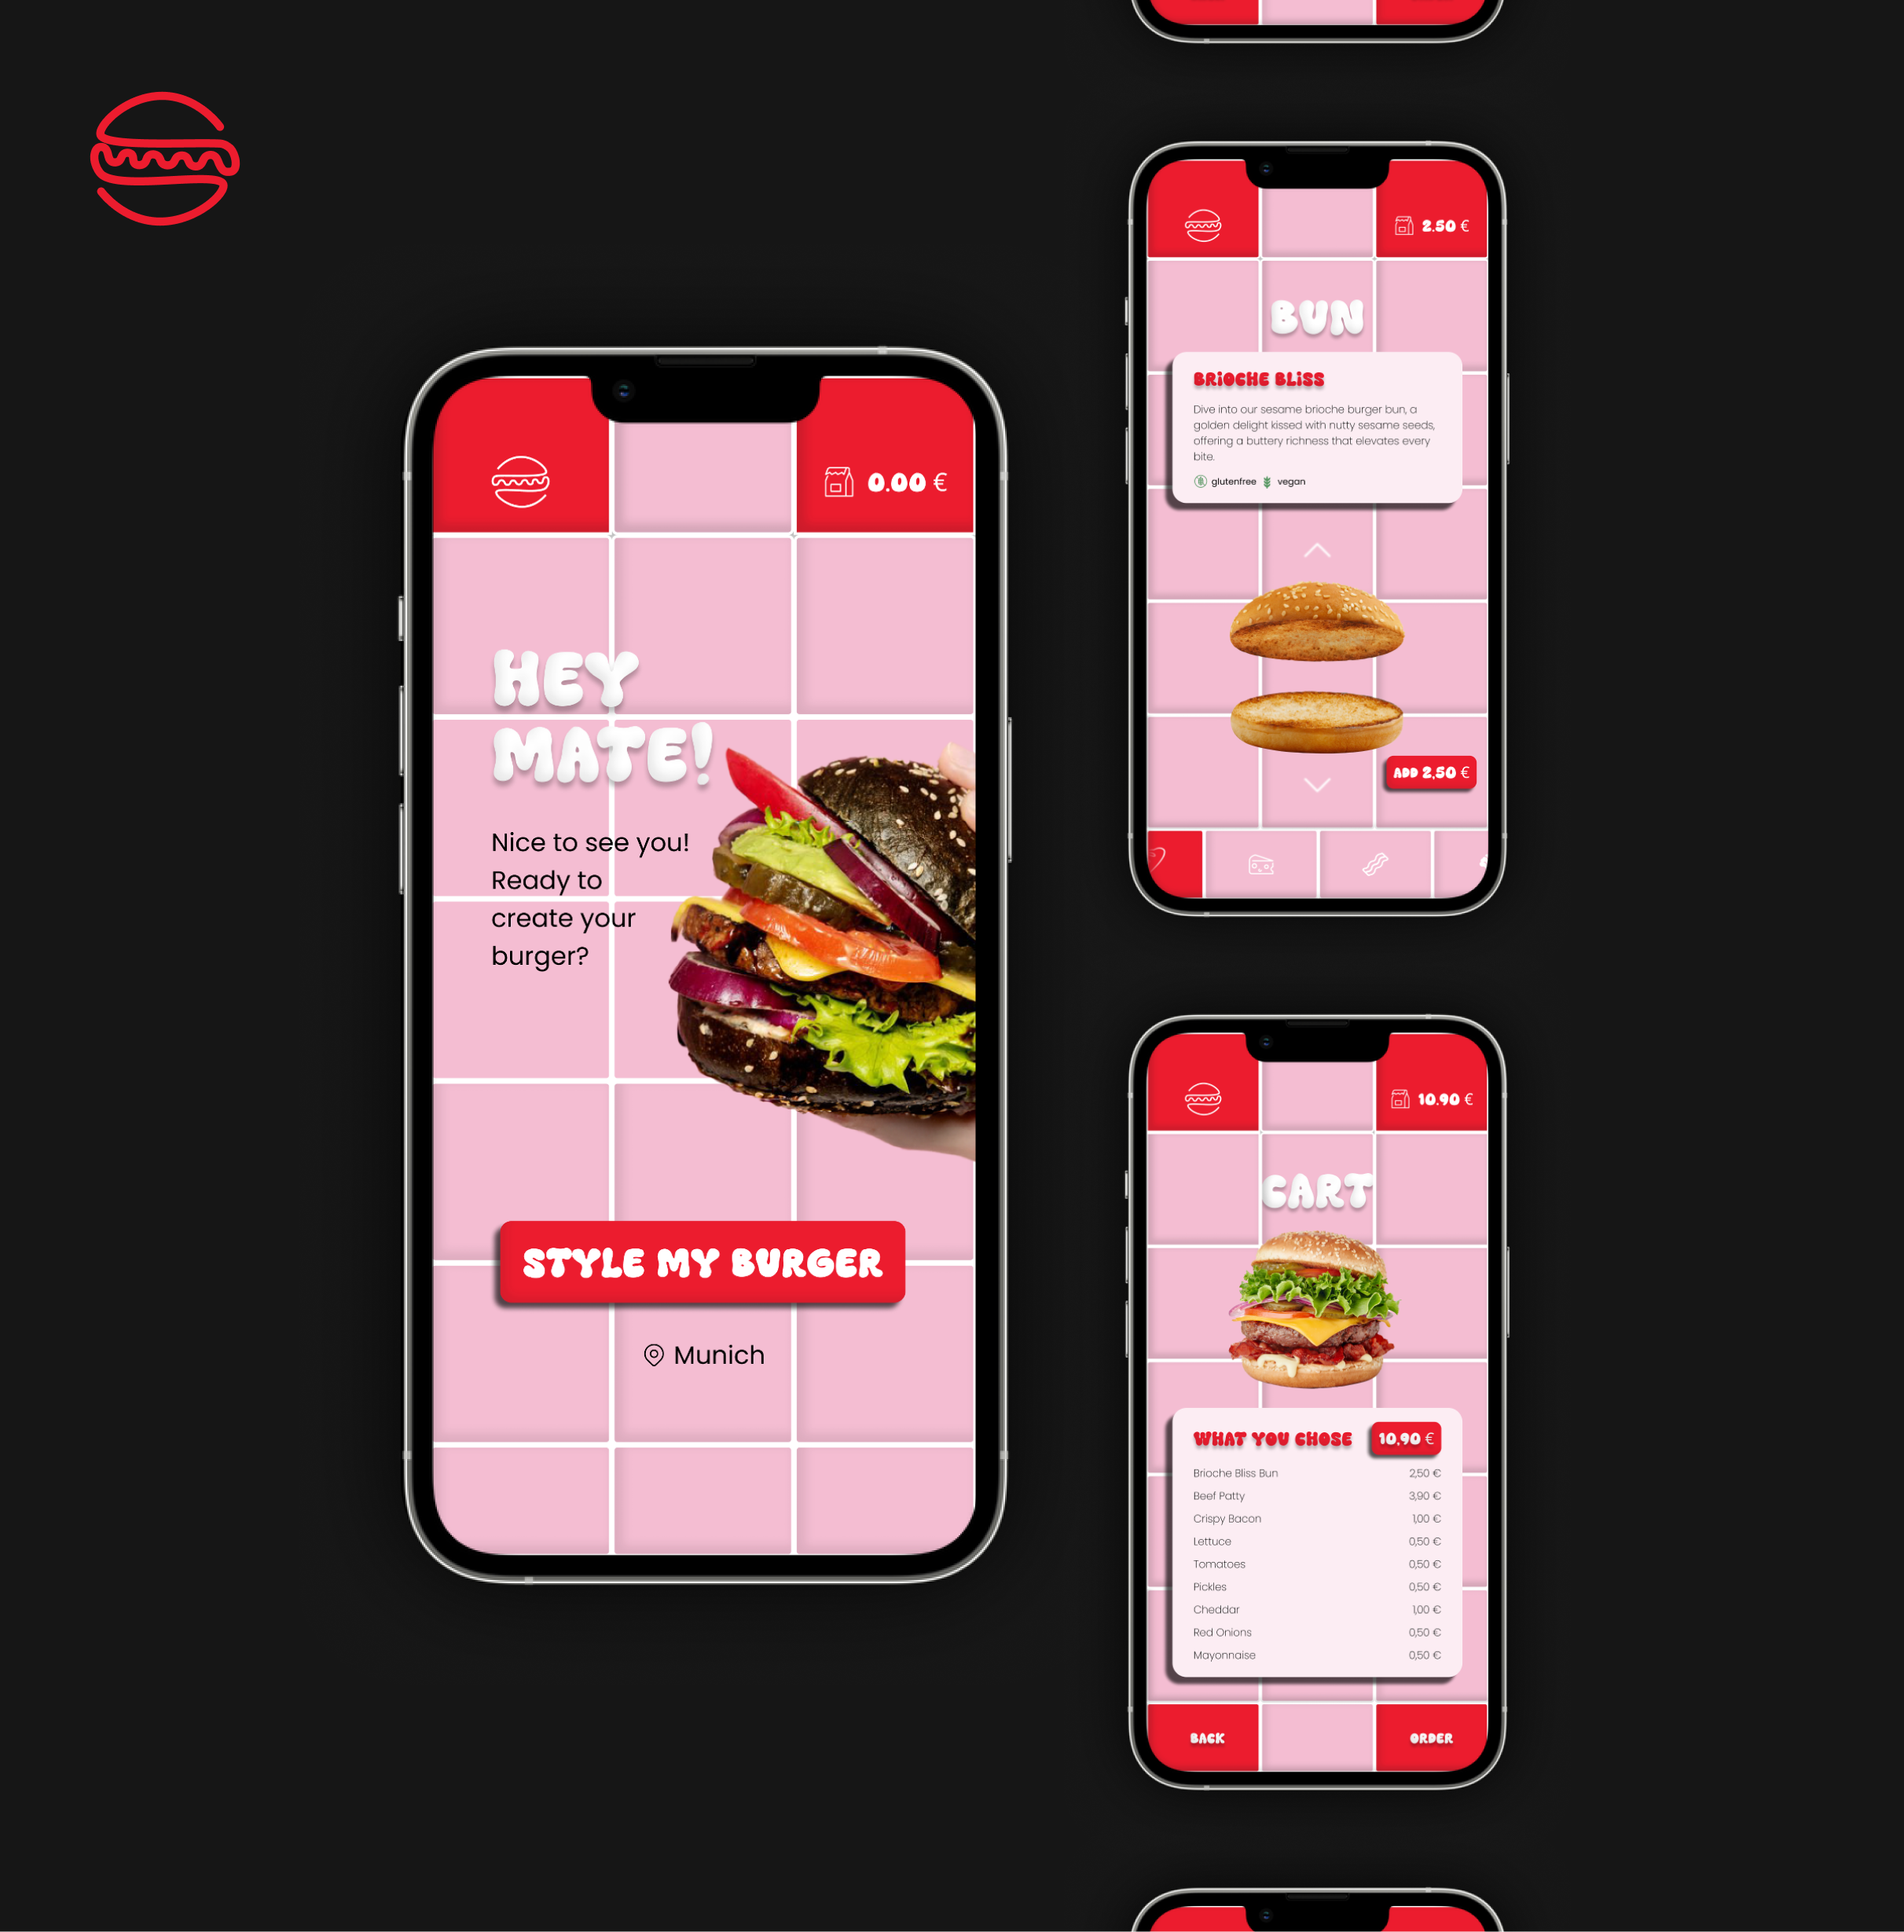
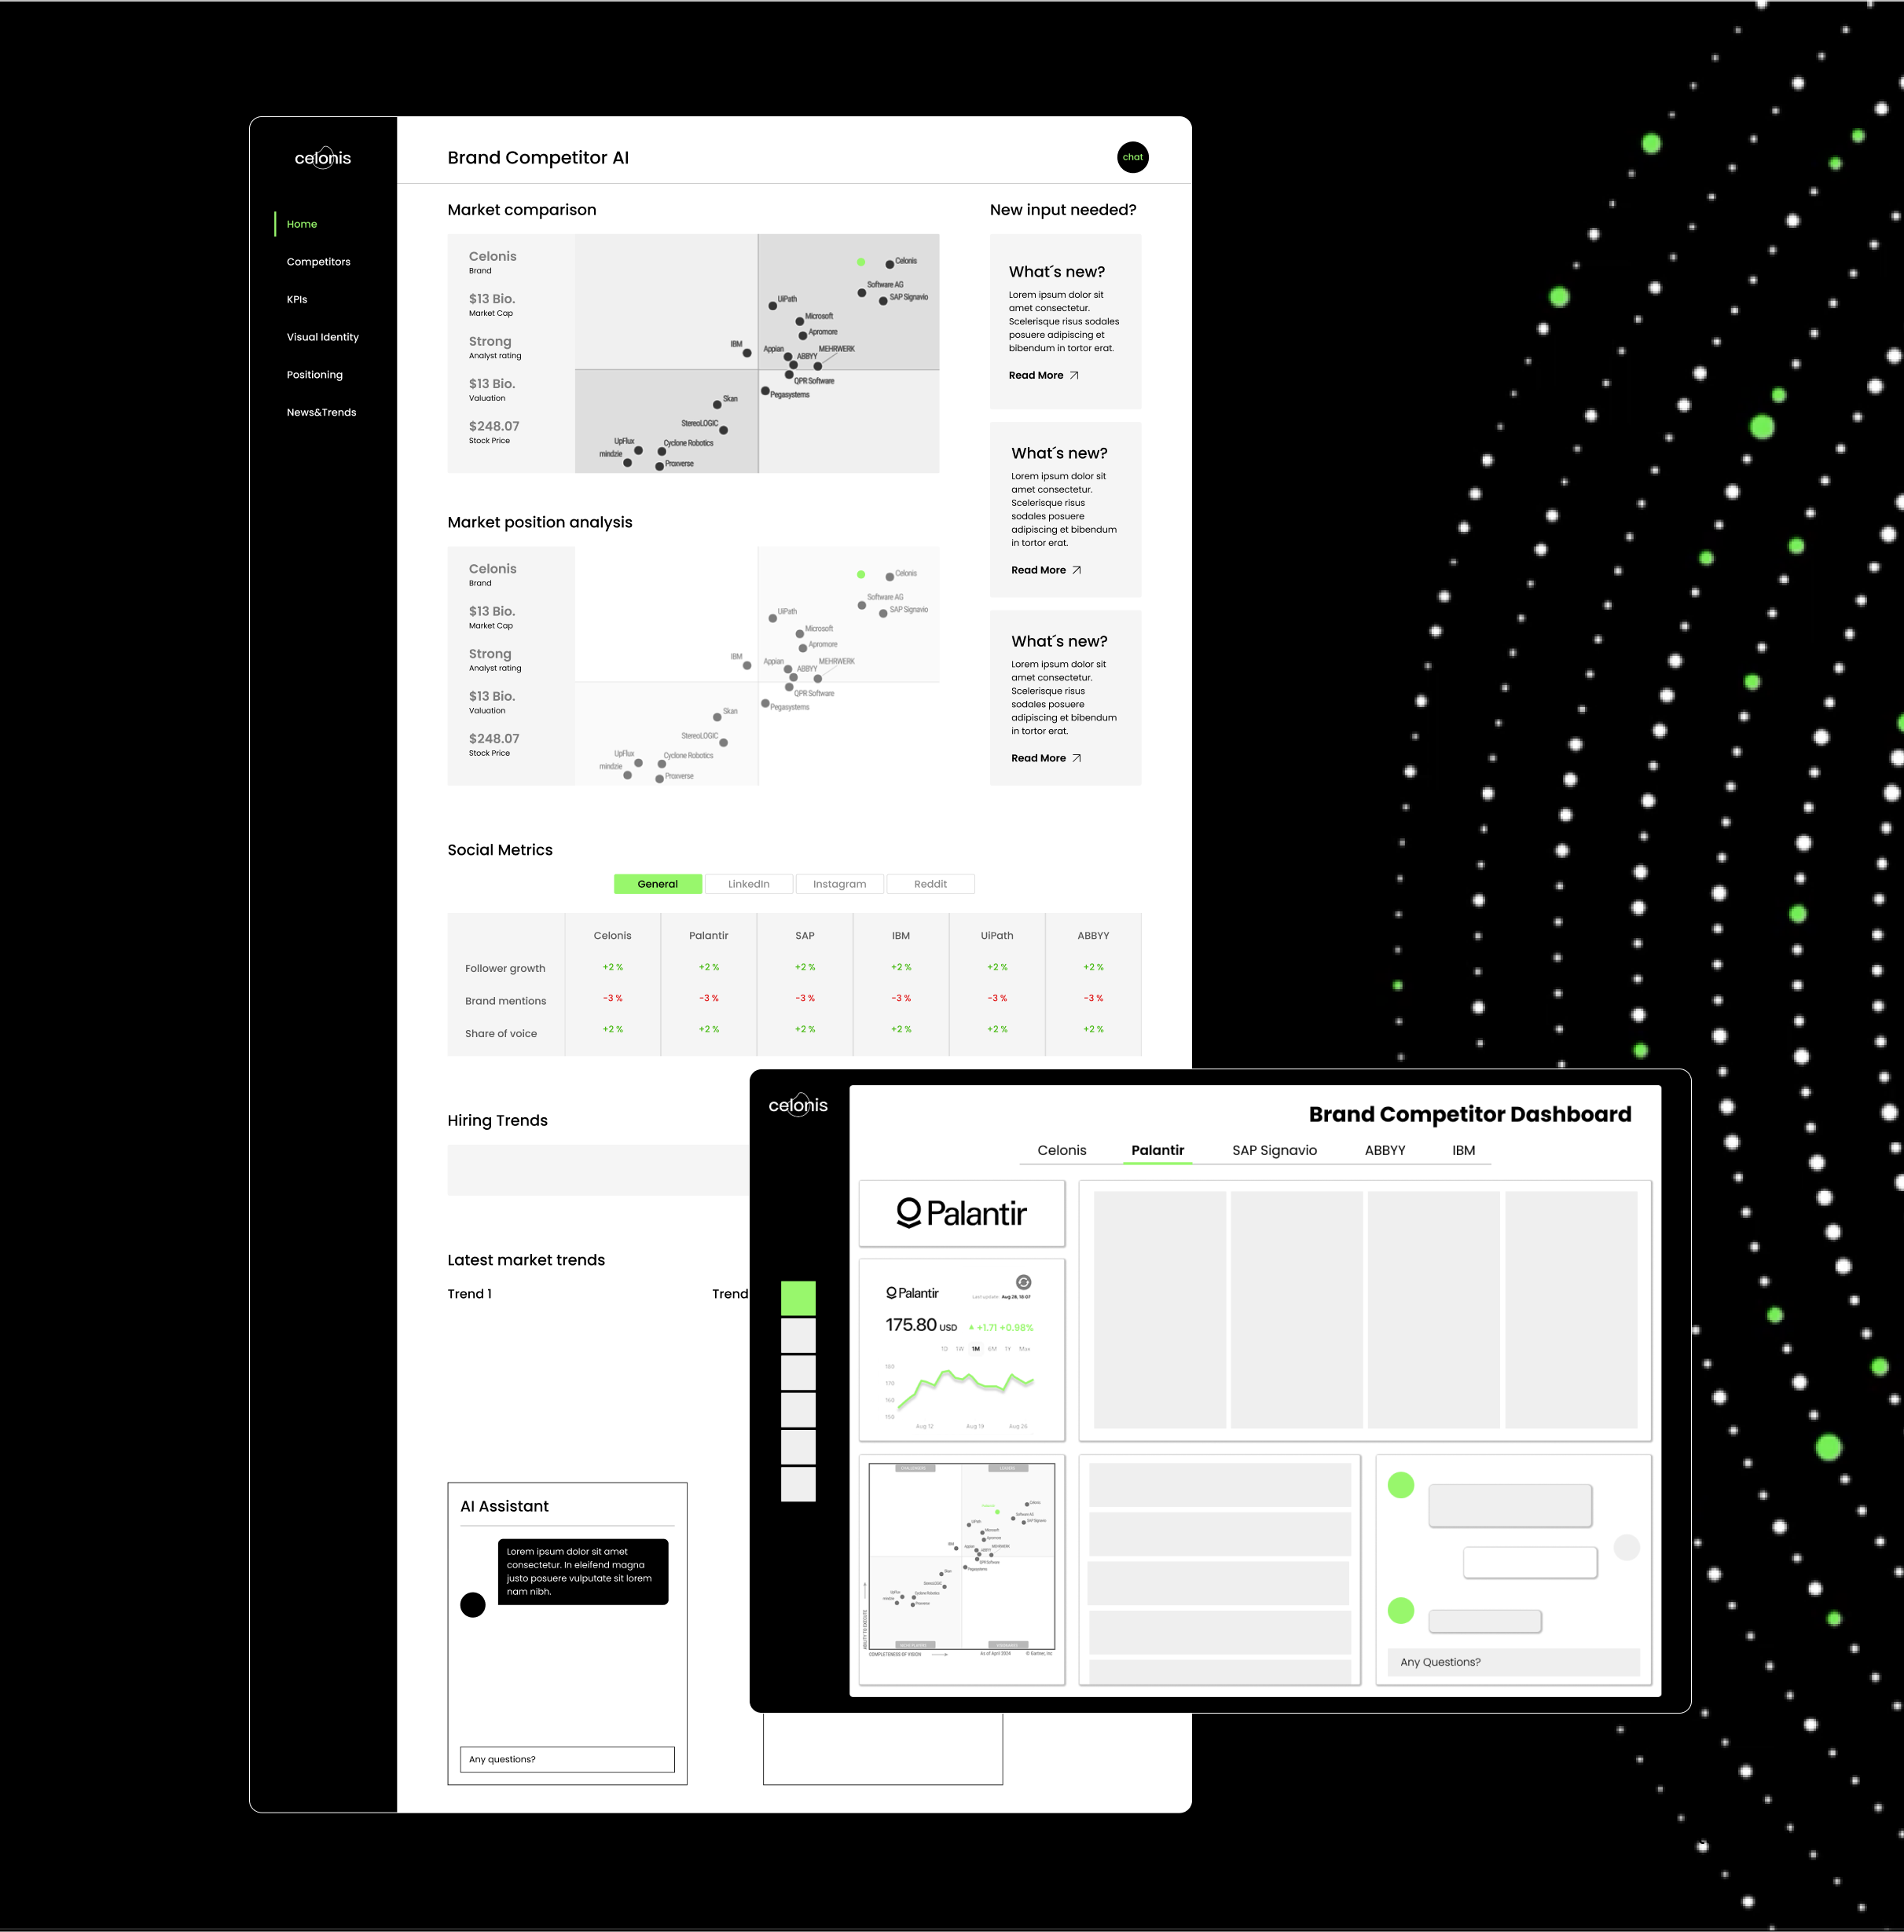
With no predefined vision for the final dashboard, our approach was to have all four team members independently create their own UI designs based on their interpretation of functionality and aesthetics. Additionally, we generated an extra concept using Lovable. We first reviewed and discussed all designs internally, and then presented them to Celonis to gather diverse ideas and feedback.
approach
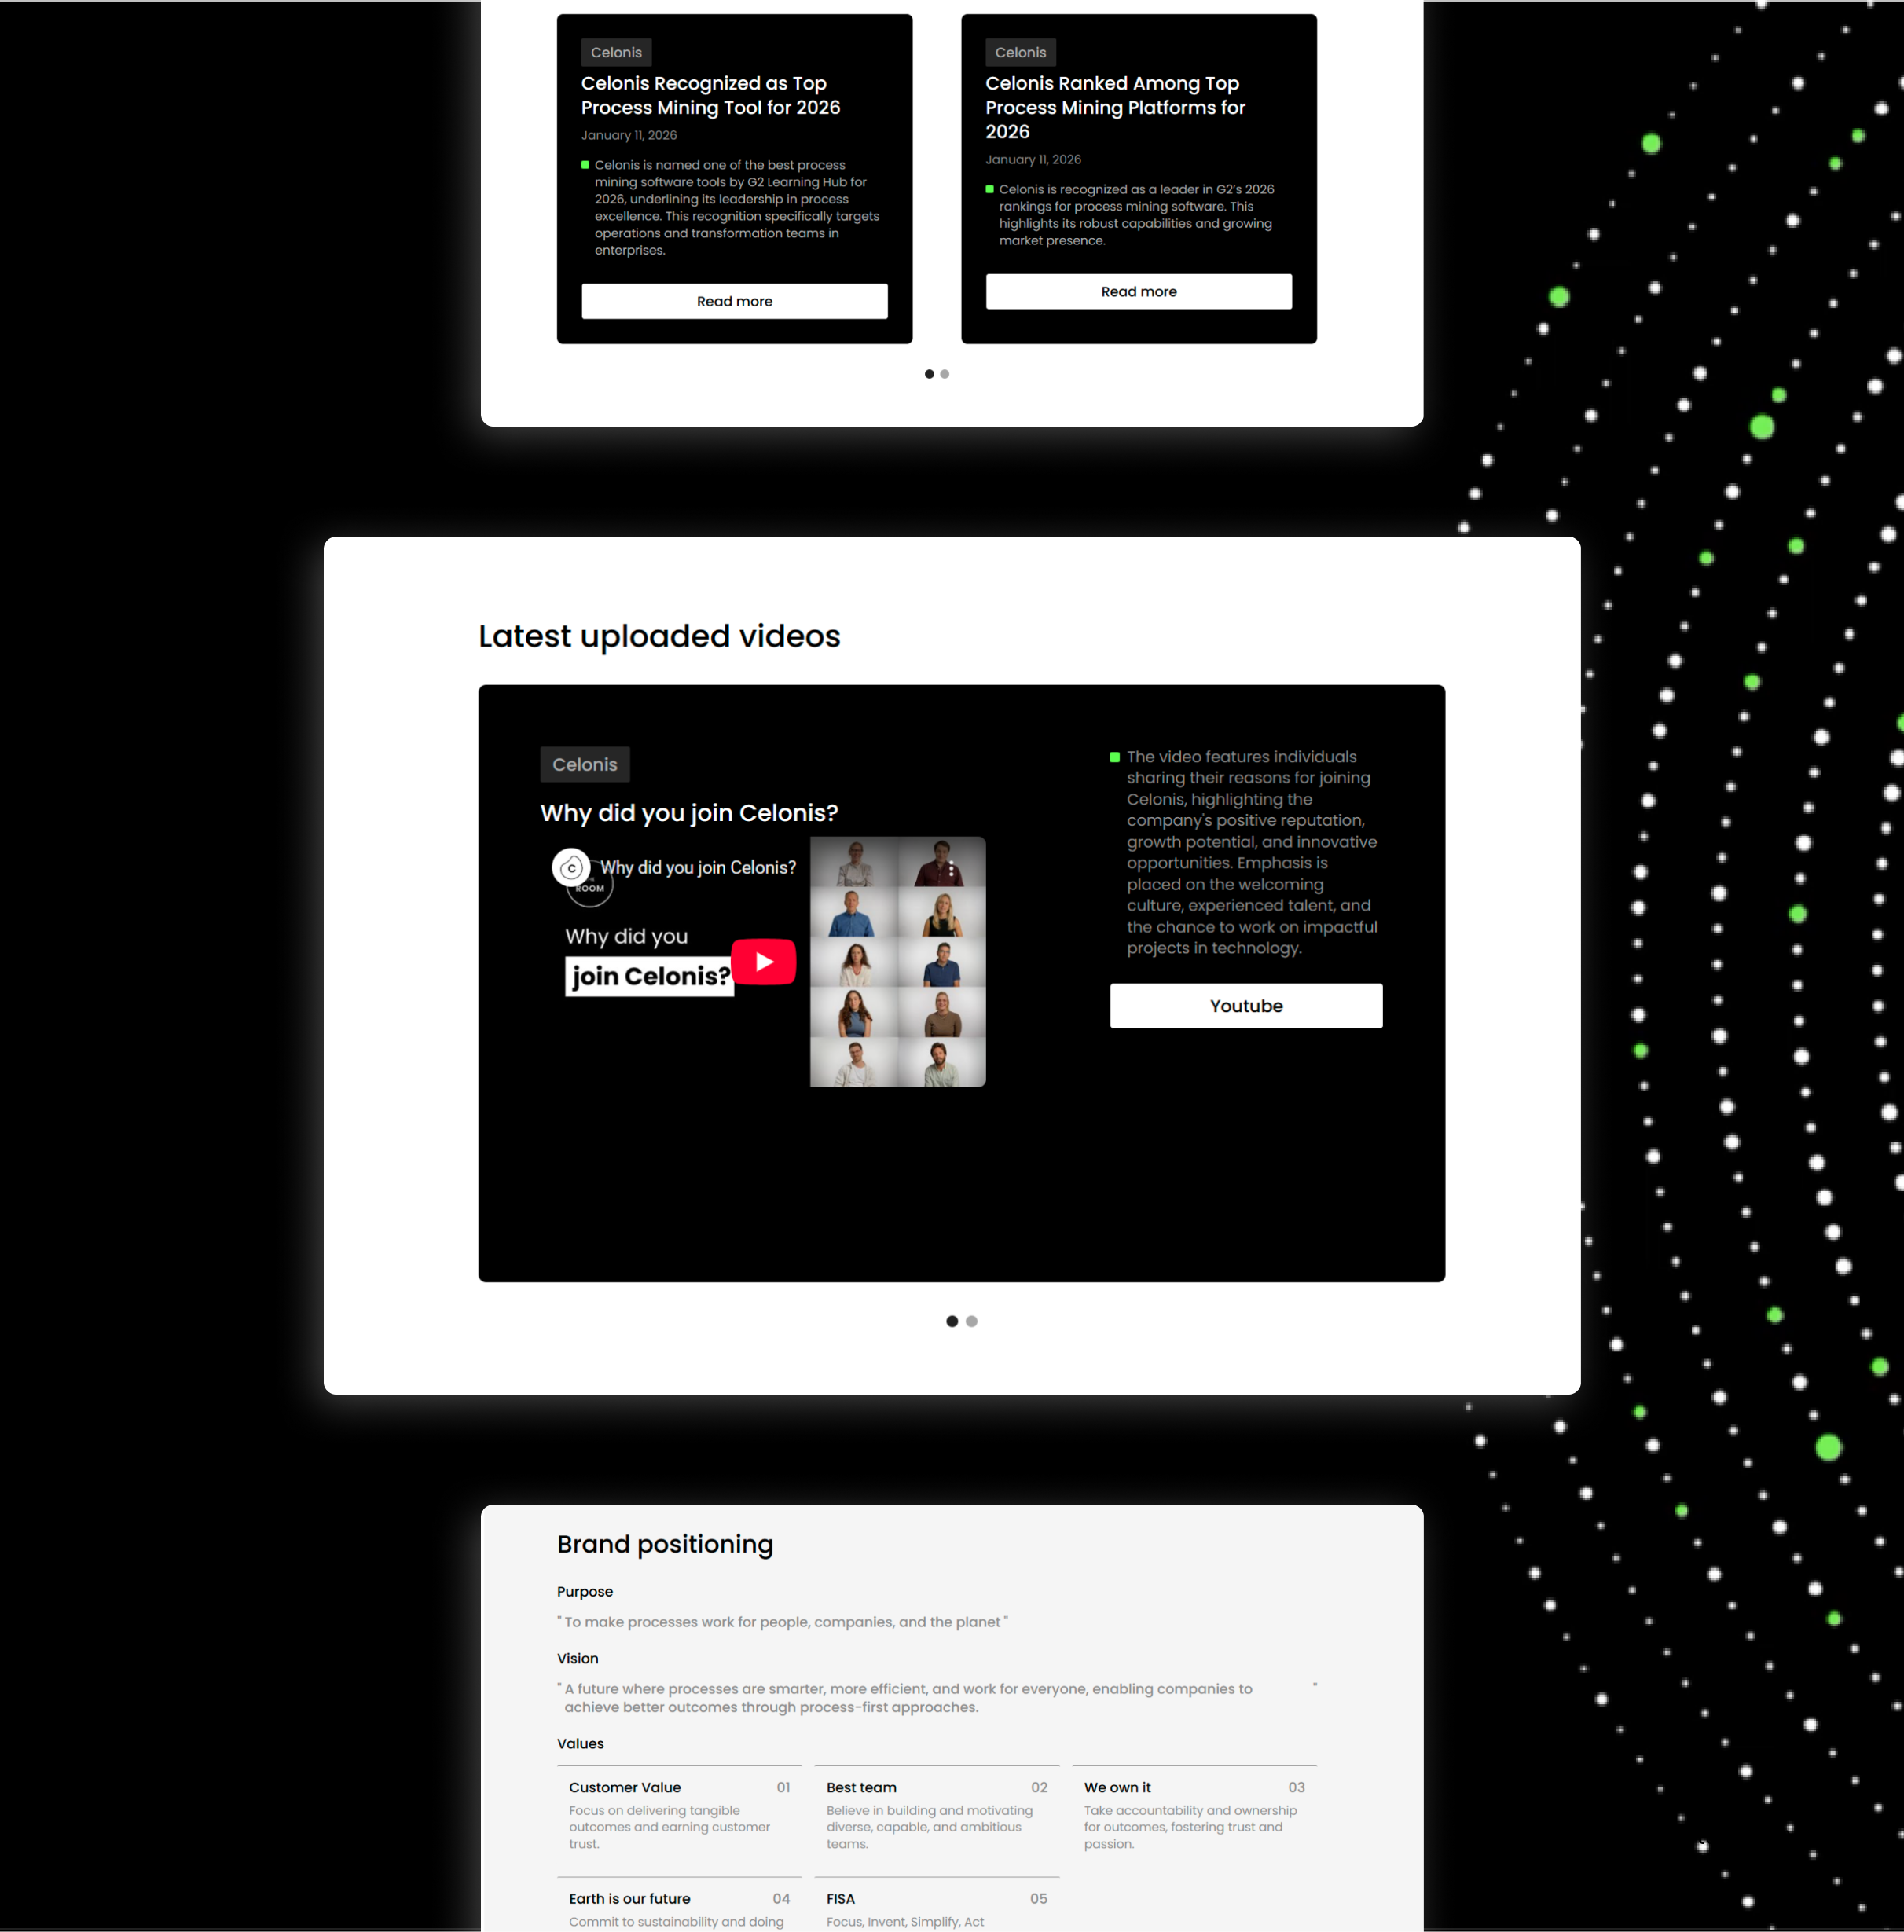
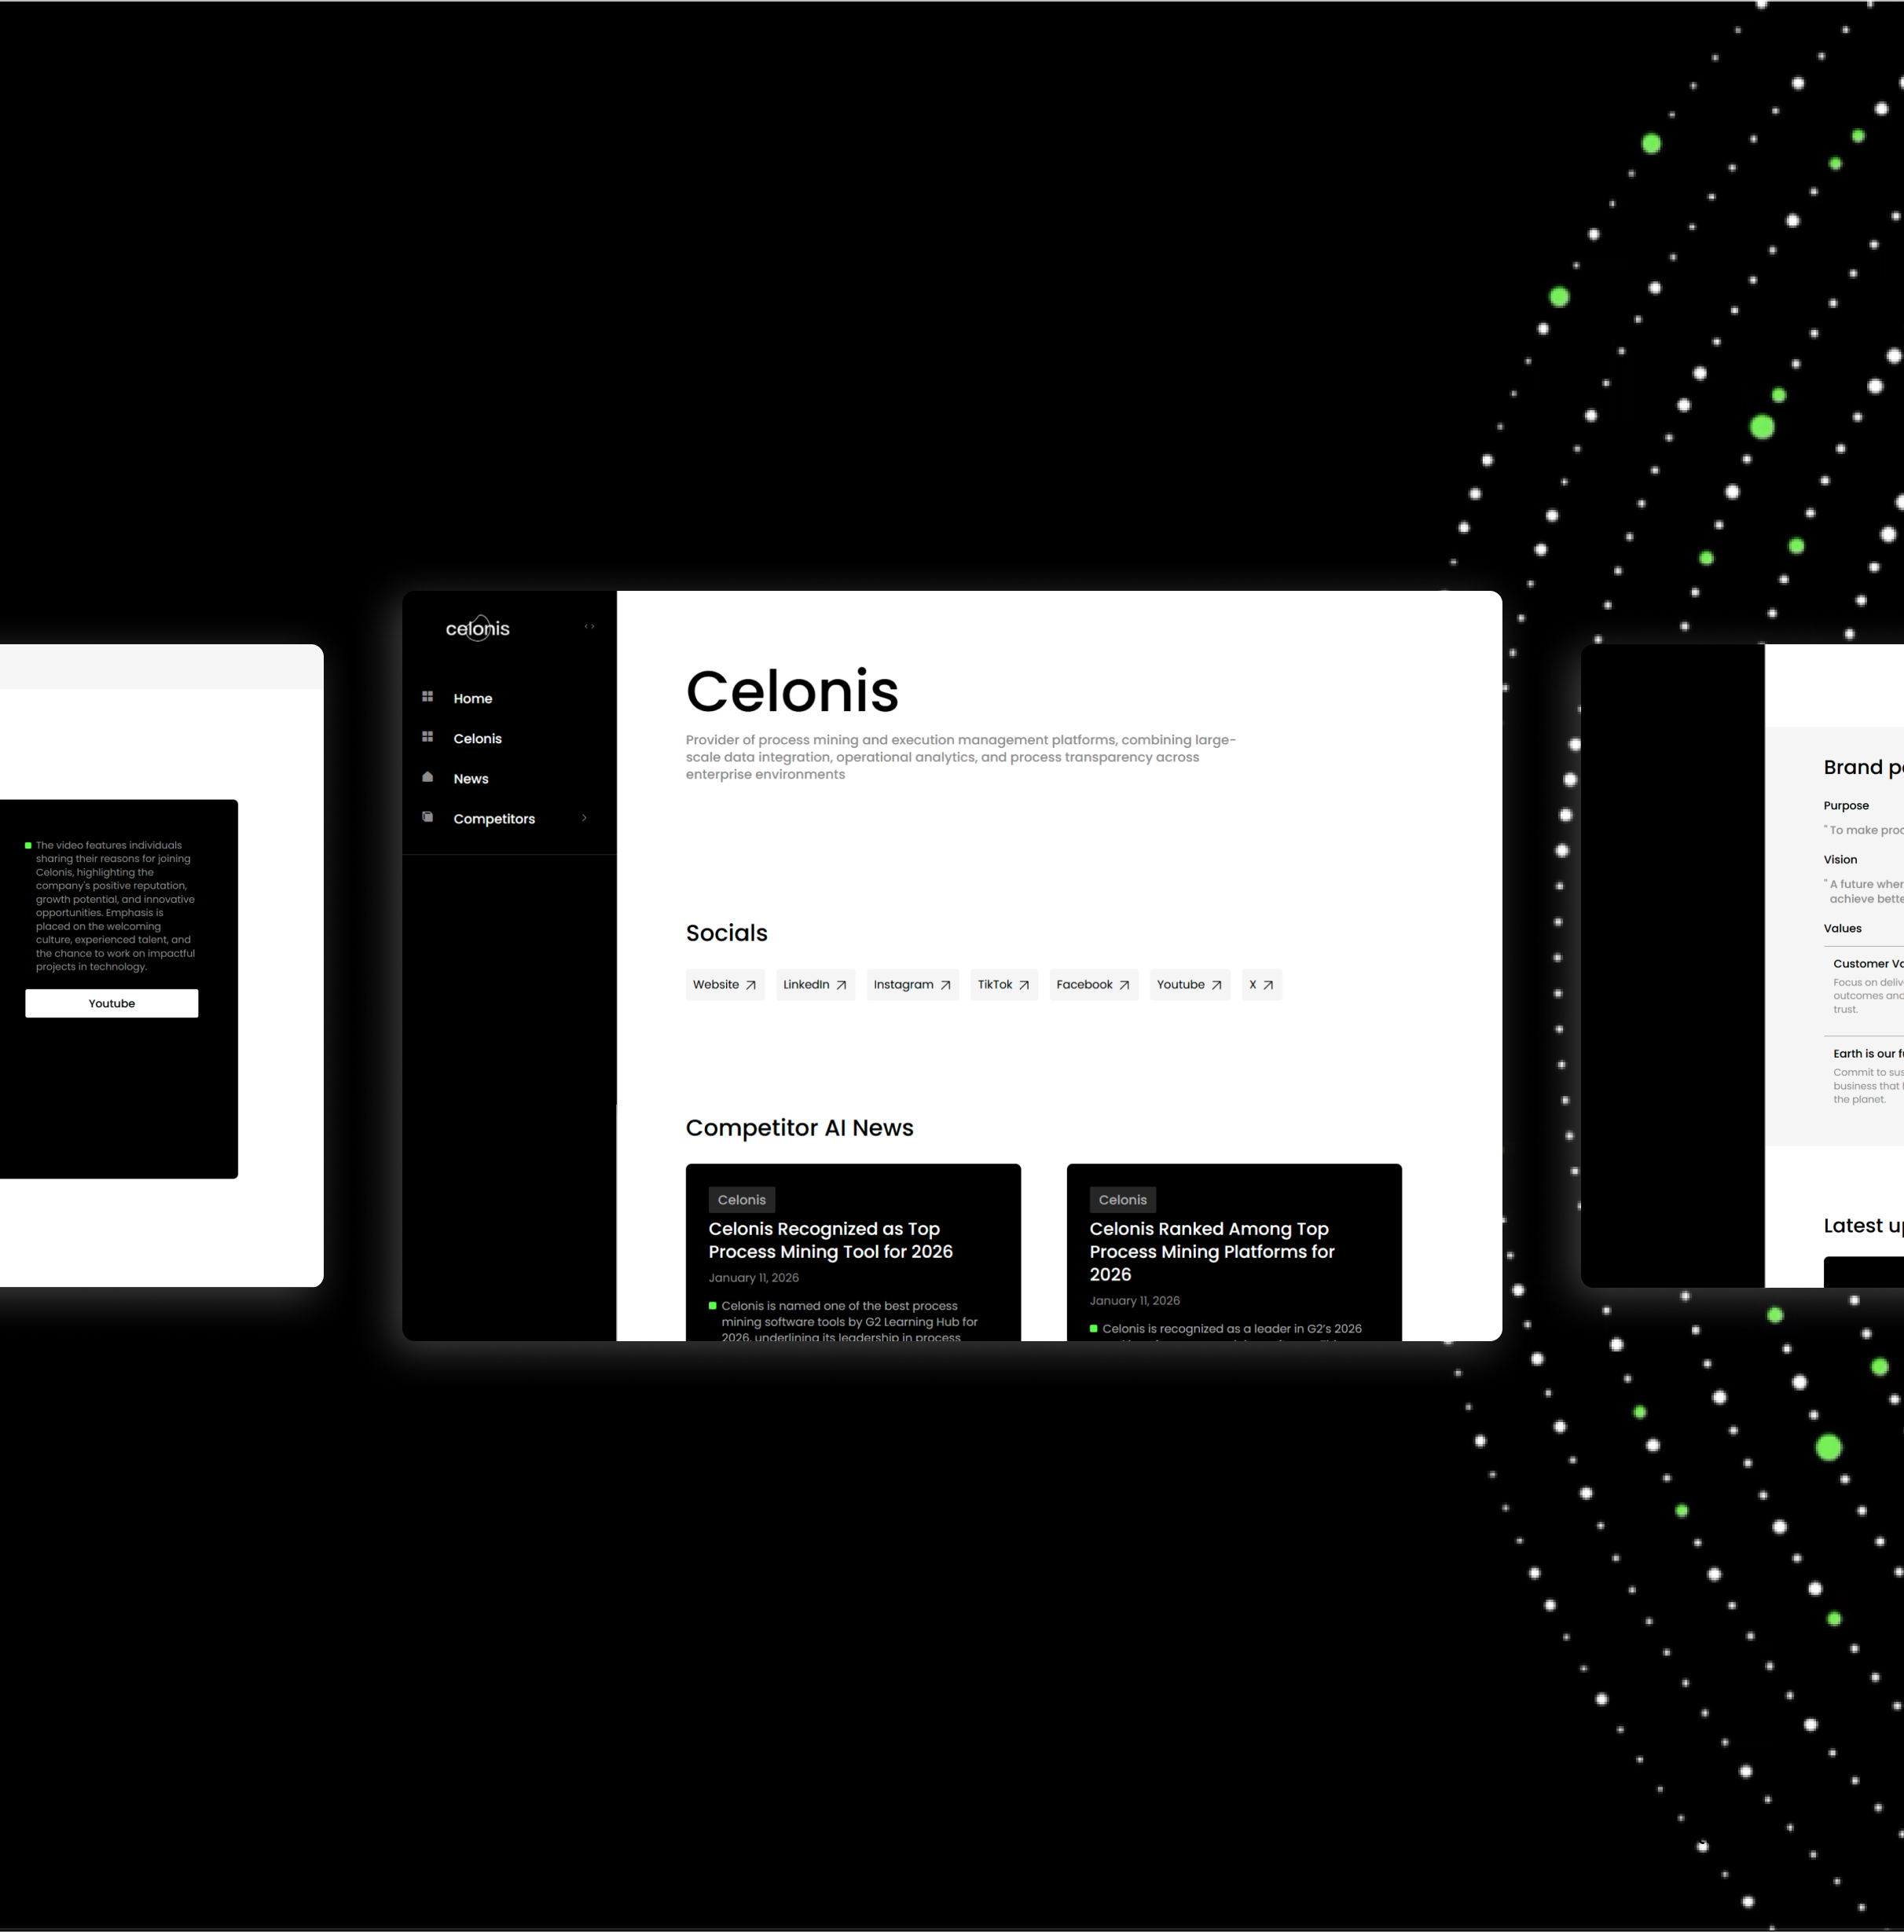
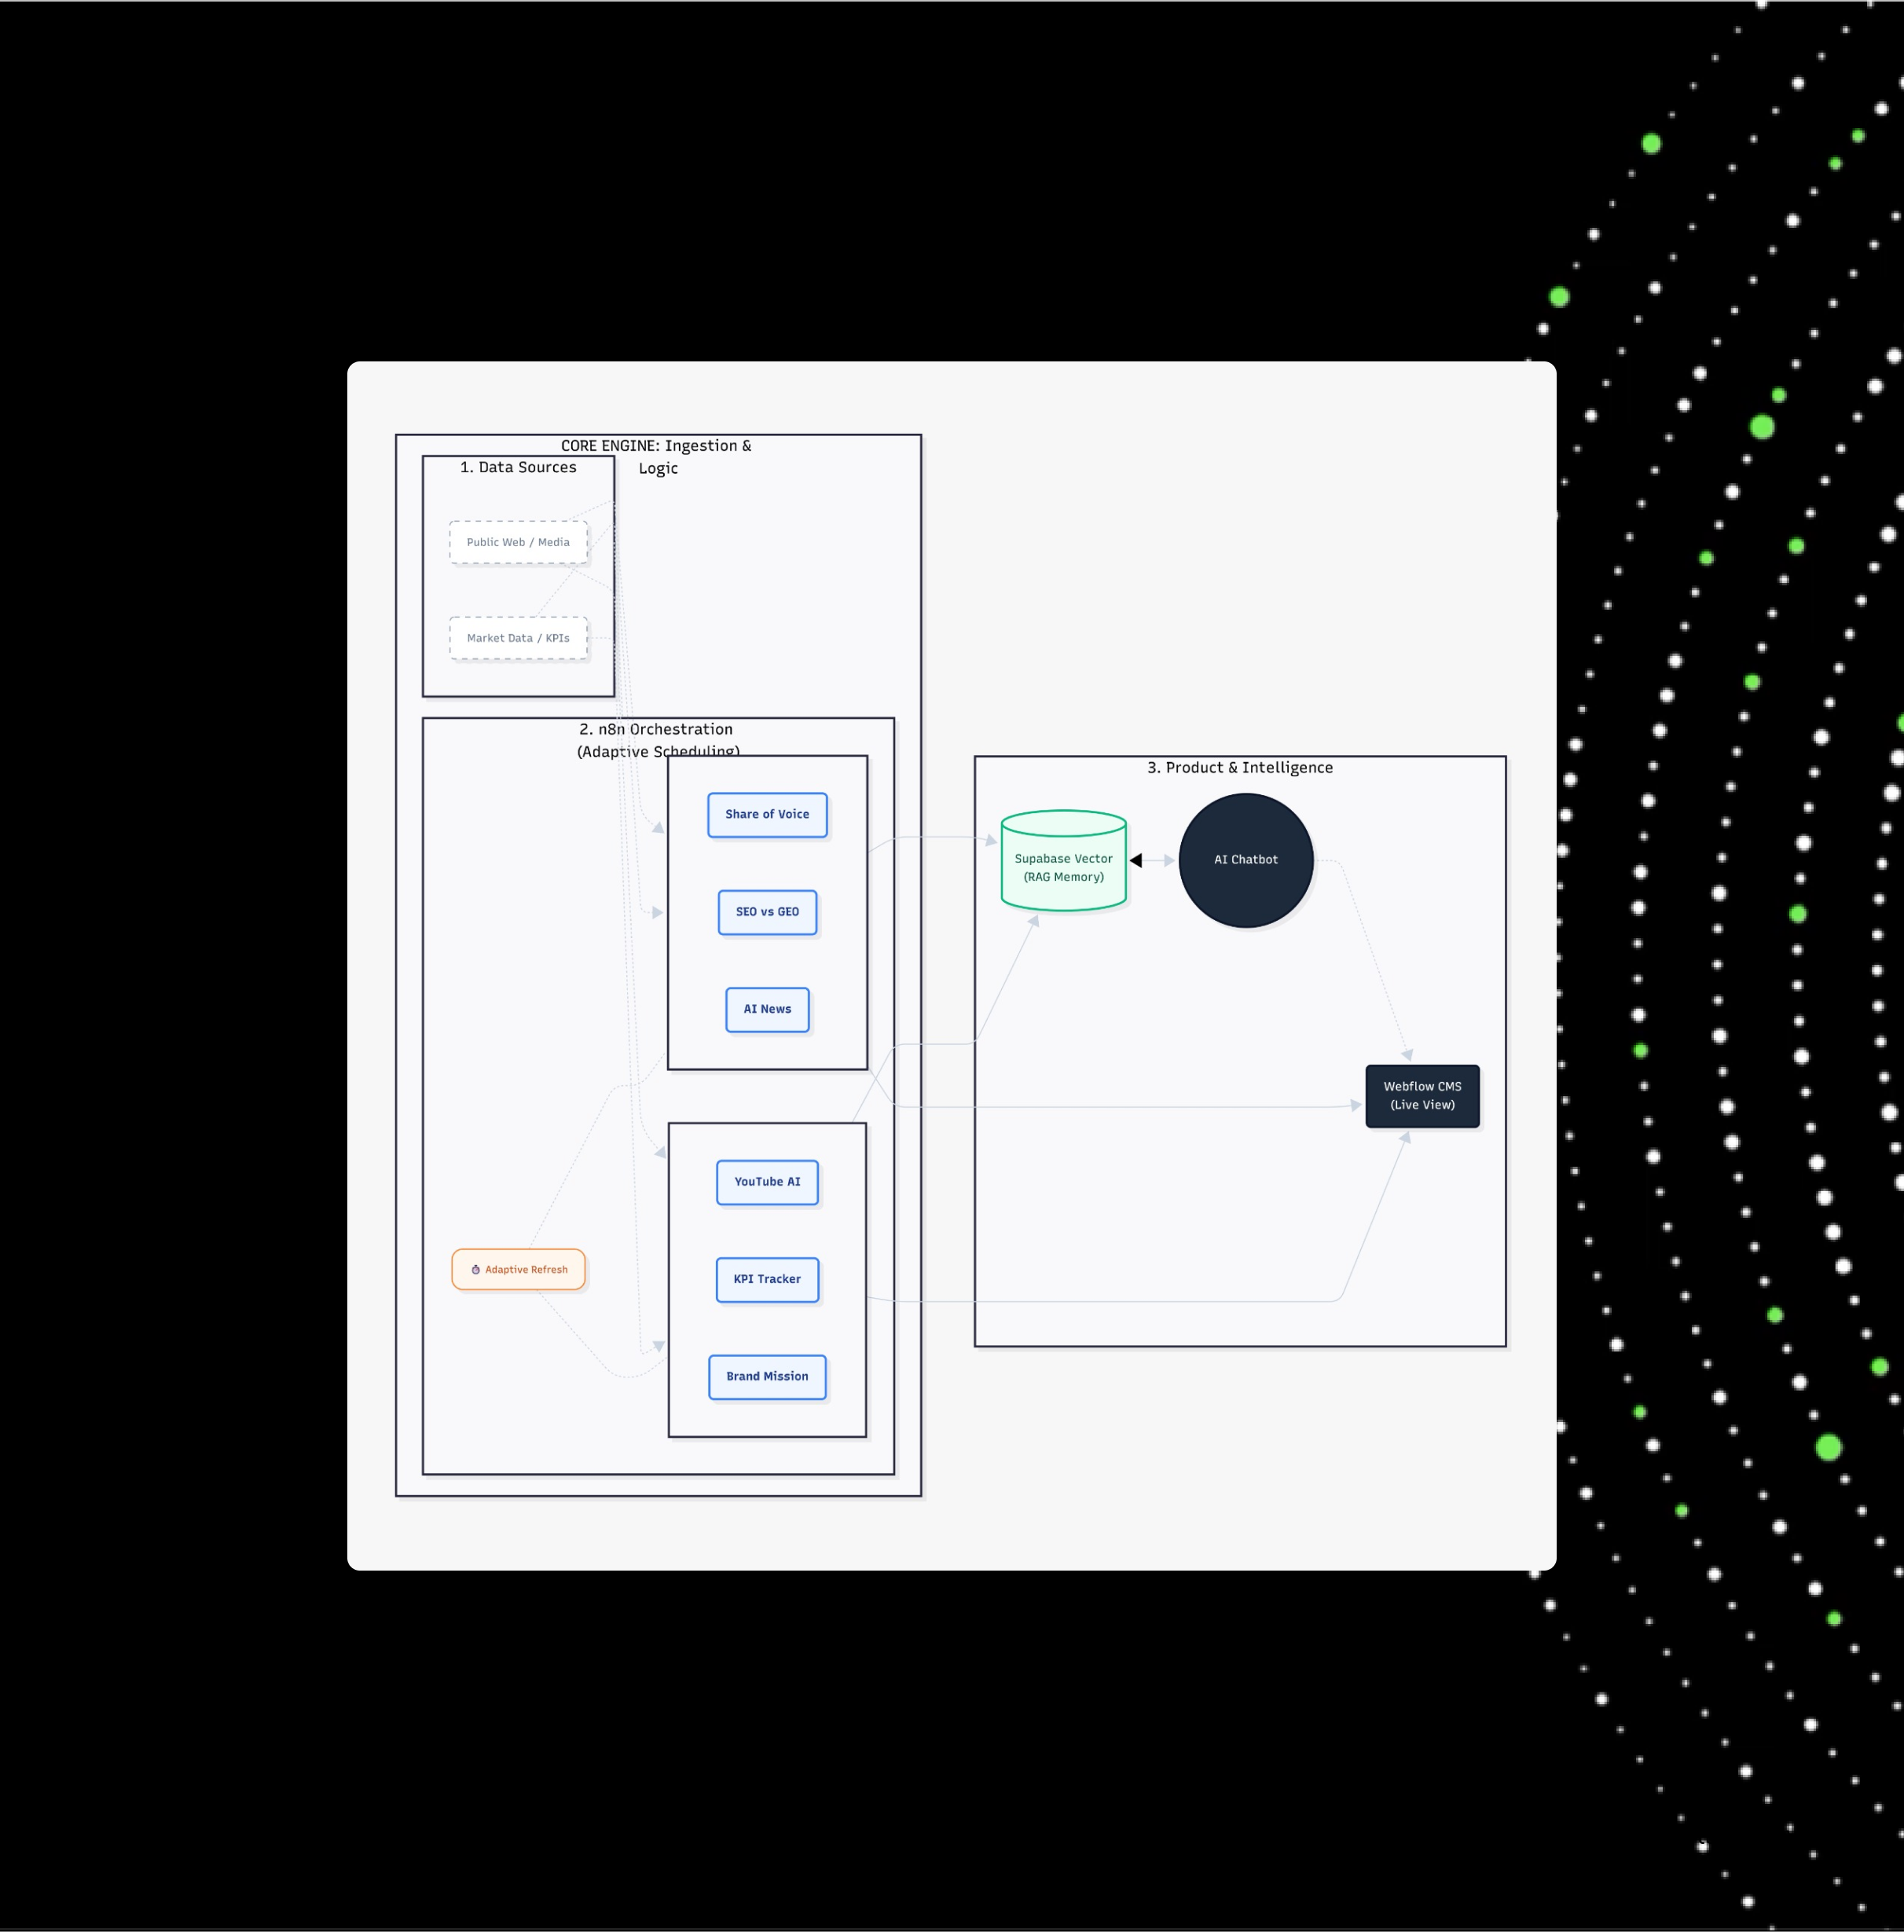
We built a modular pipeline where the Ingestion Layer aggregates data from public media scrapers like Firecrawl and structured market APIs with an adaptive refresh for efficiency. The n8n Orchestration Layer processes quantitative and qualitative signals through six decoupled workflows to ensure stability. Processed data is vectorized and stored in Supabase as a persistent RAG memory for long-term insights and structured results are pushed to Webflow, using custom code or CMS collections to visualize real-time metrics and charts.
approach
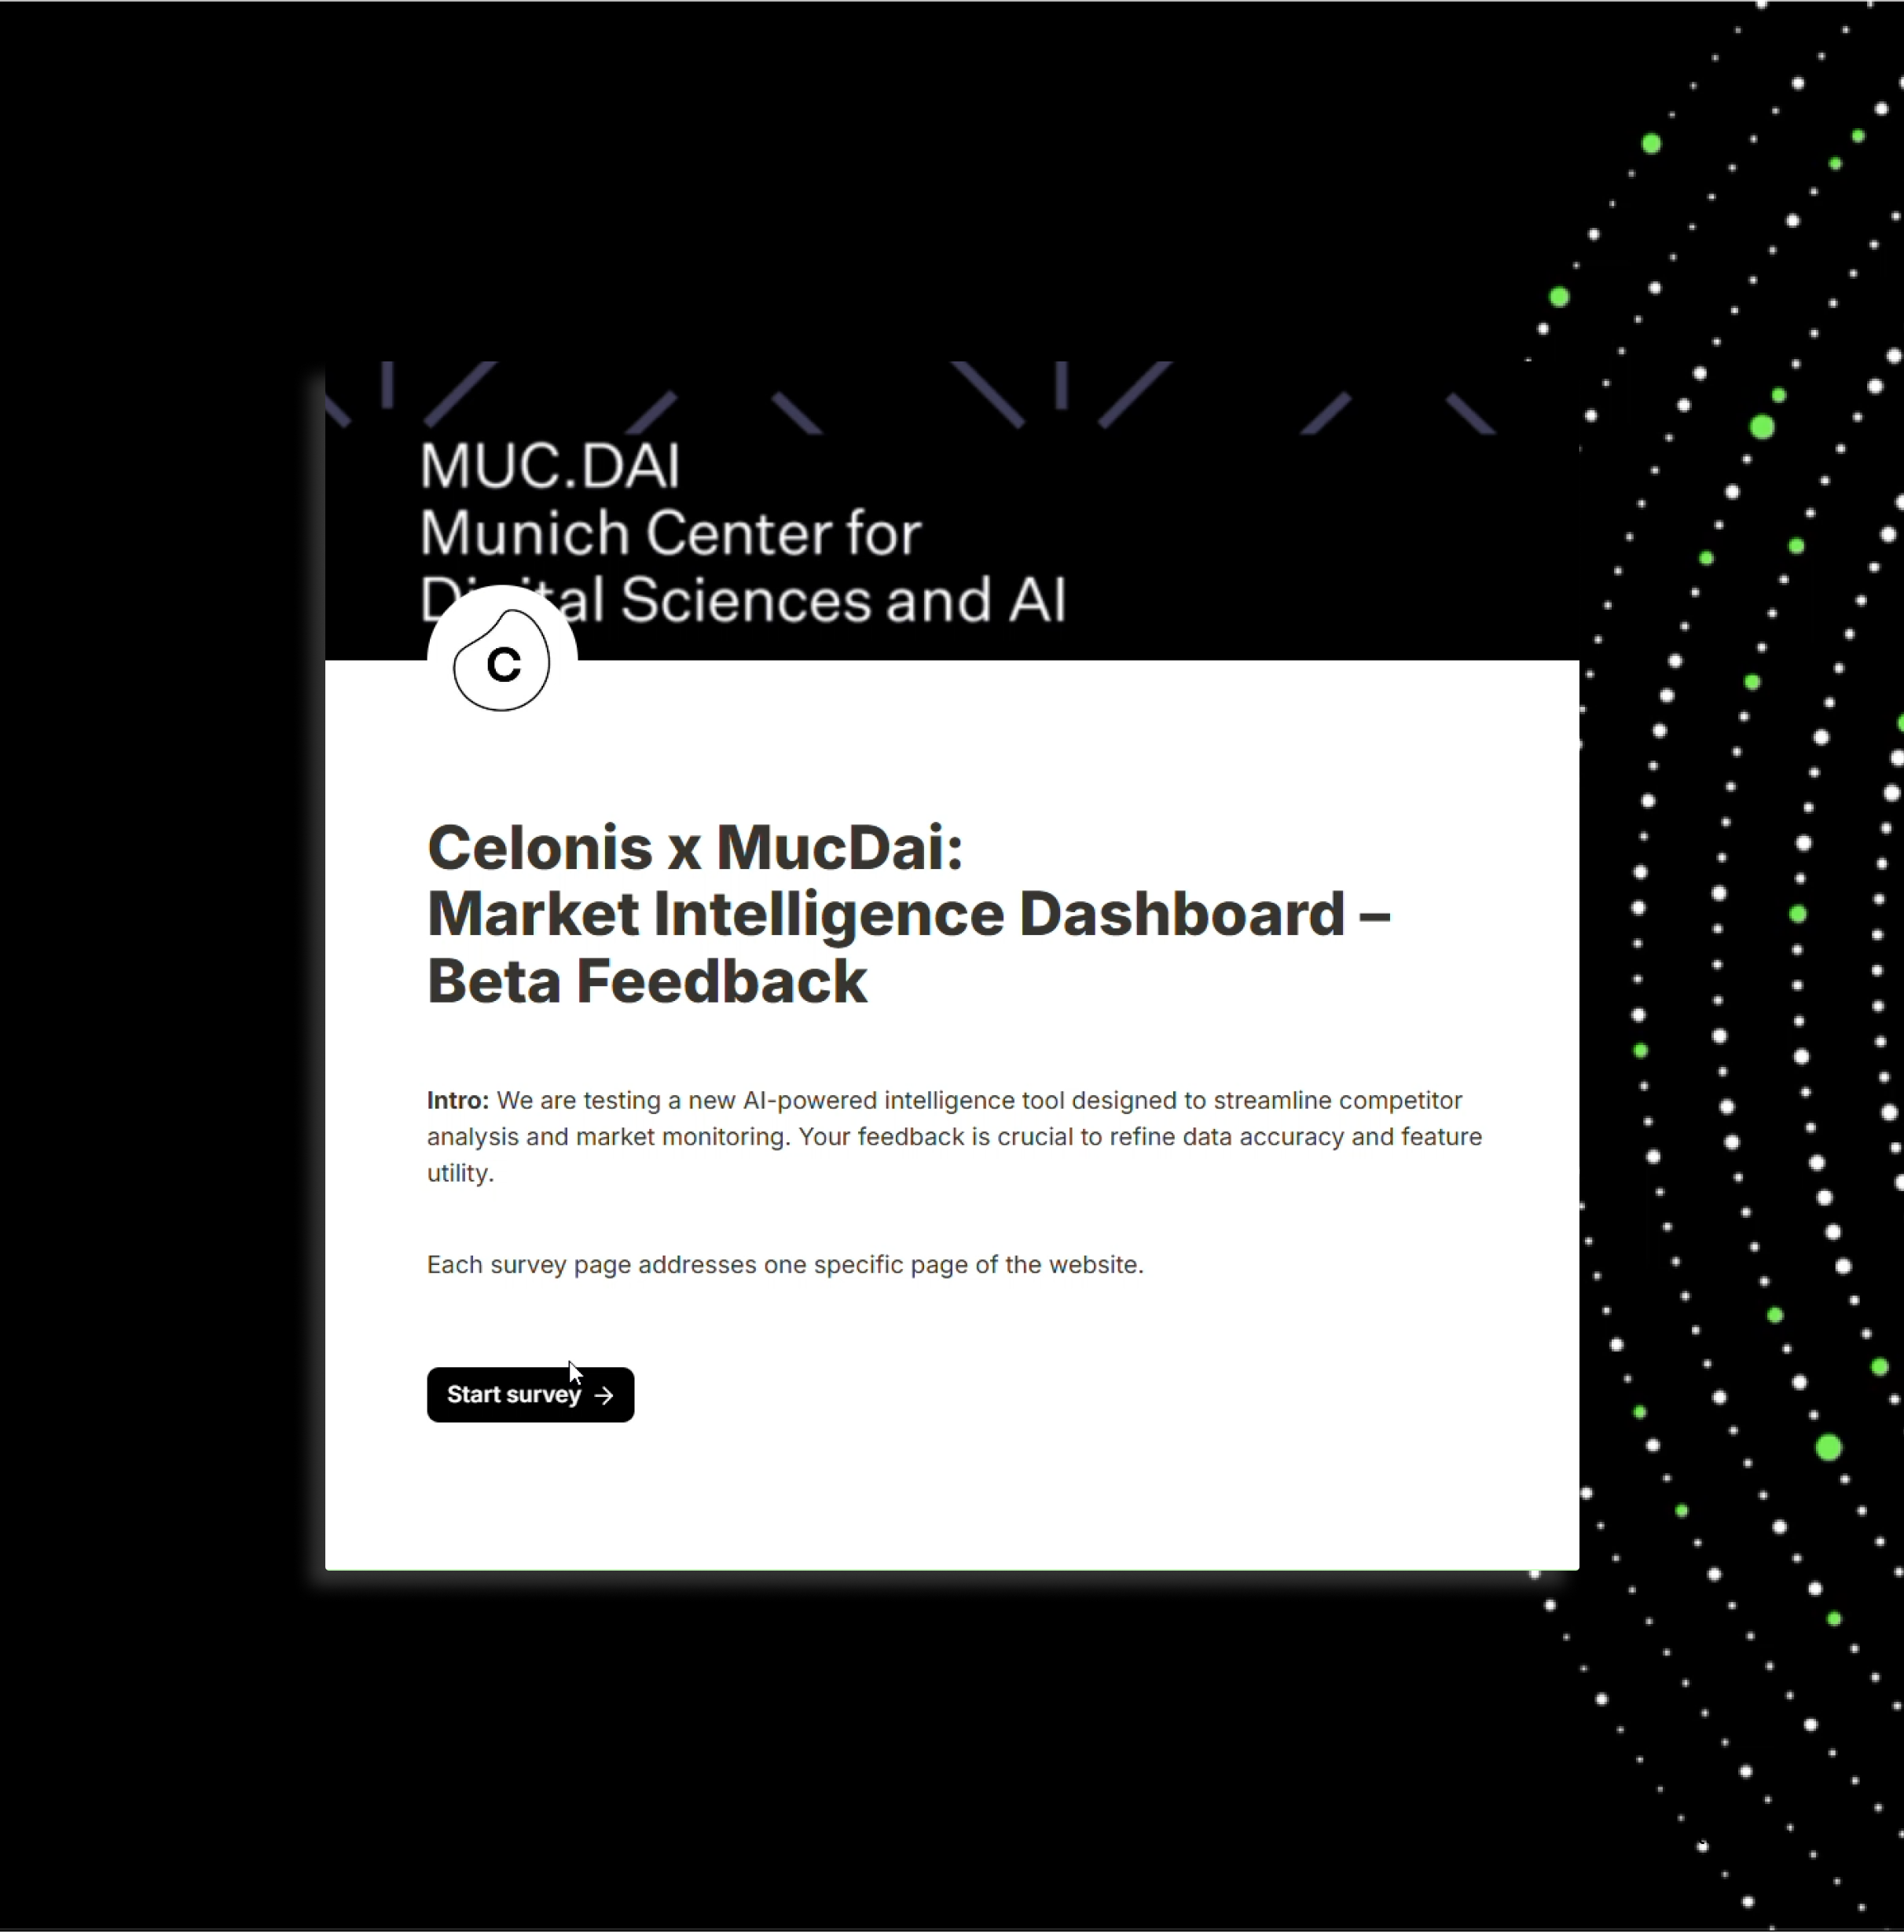
We collected initial feedback through an online survey and used it to improve the product, for example by providing clearer explanations for individual charts. We also agreed to continue the project to implement a fully functional product within the department.
applied services
services
UX Research
UI Design
Prototyping
Web Development
Agentic AI
result
result
We have reached the first milestone, generating initial data and insights. The next step is to identify correlations between datasets to produce valuable insights that will help the Brand team plan more effectively for the future. This work is currently being continued during the Summer Semester 2026.