Phone data visualization
Client
University Project
Role
UX/UI Designer, Developer
Duration
4 Months
Techstack
Request
Exploration and analyzation of personal data, extracting insights, and visually presenting the scraped data within an intuitive and engaging website experience.
challenges
ideation
approach
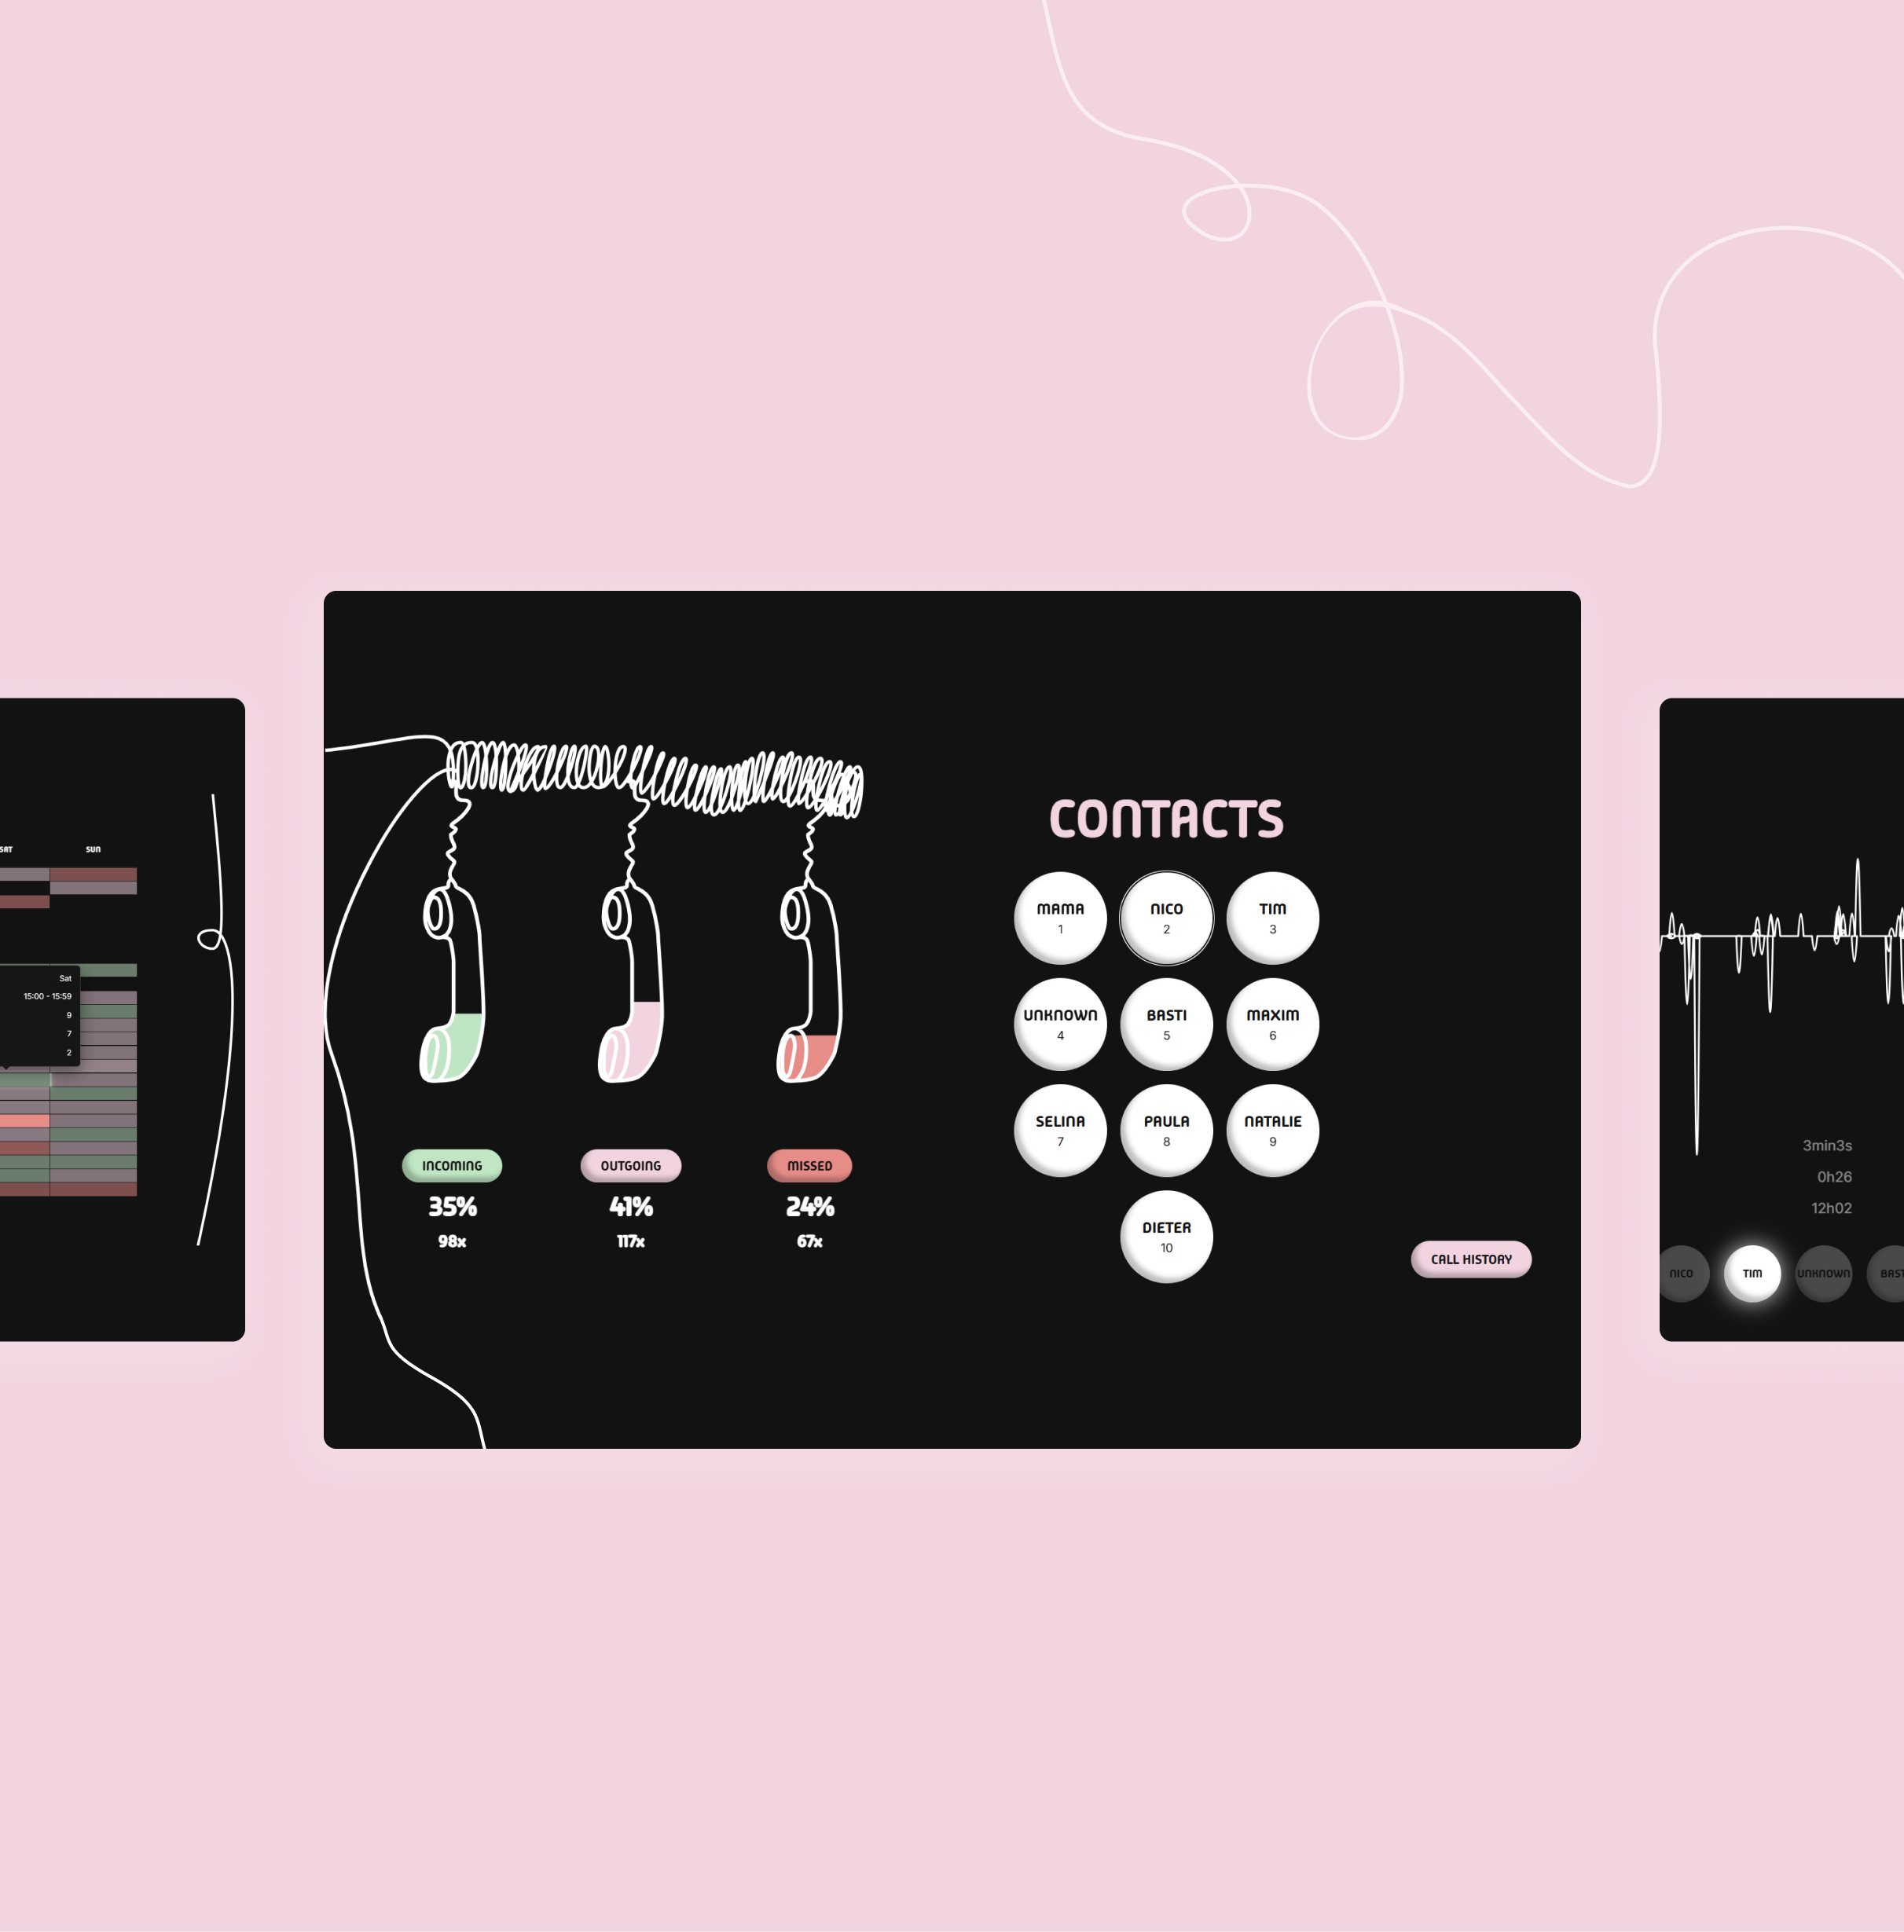
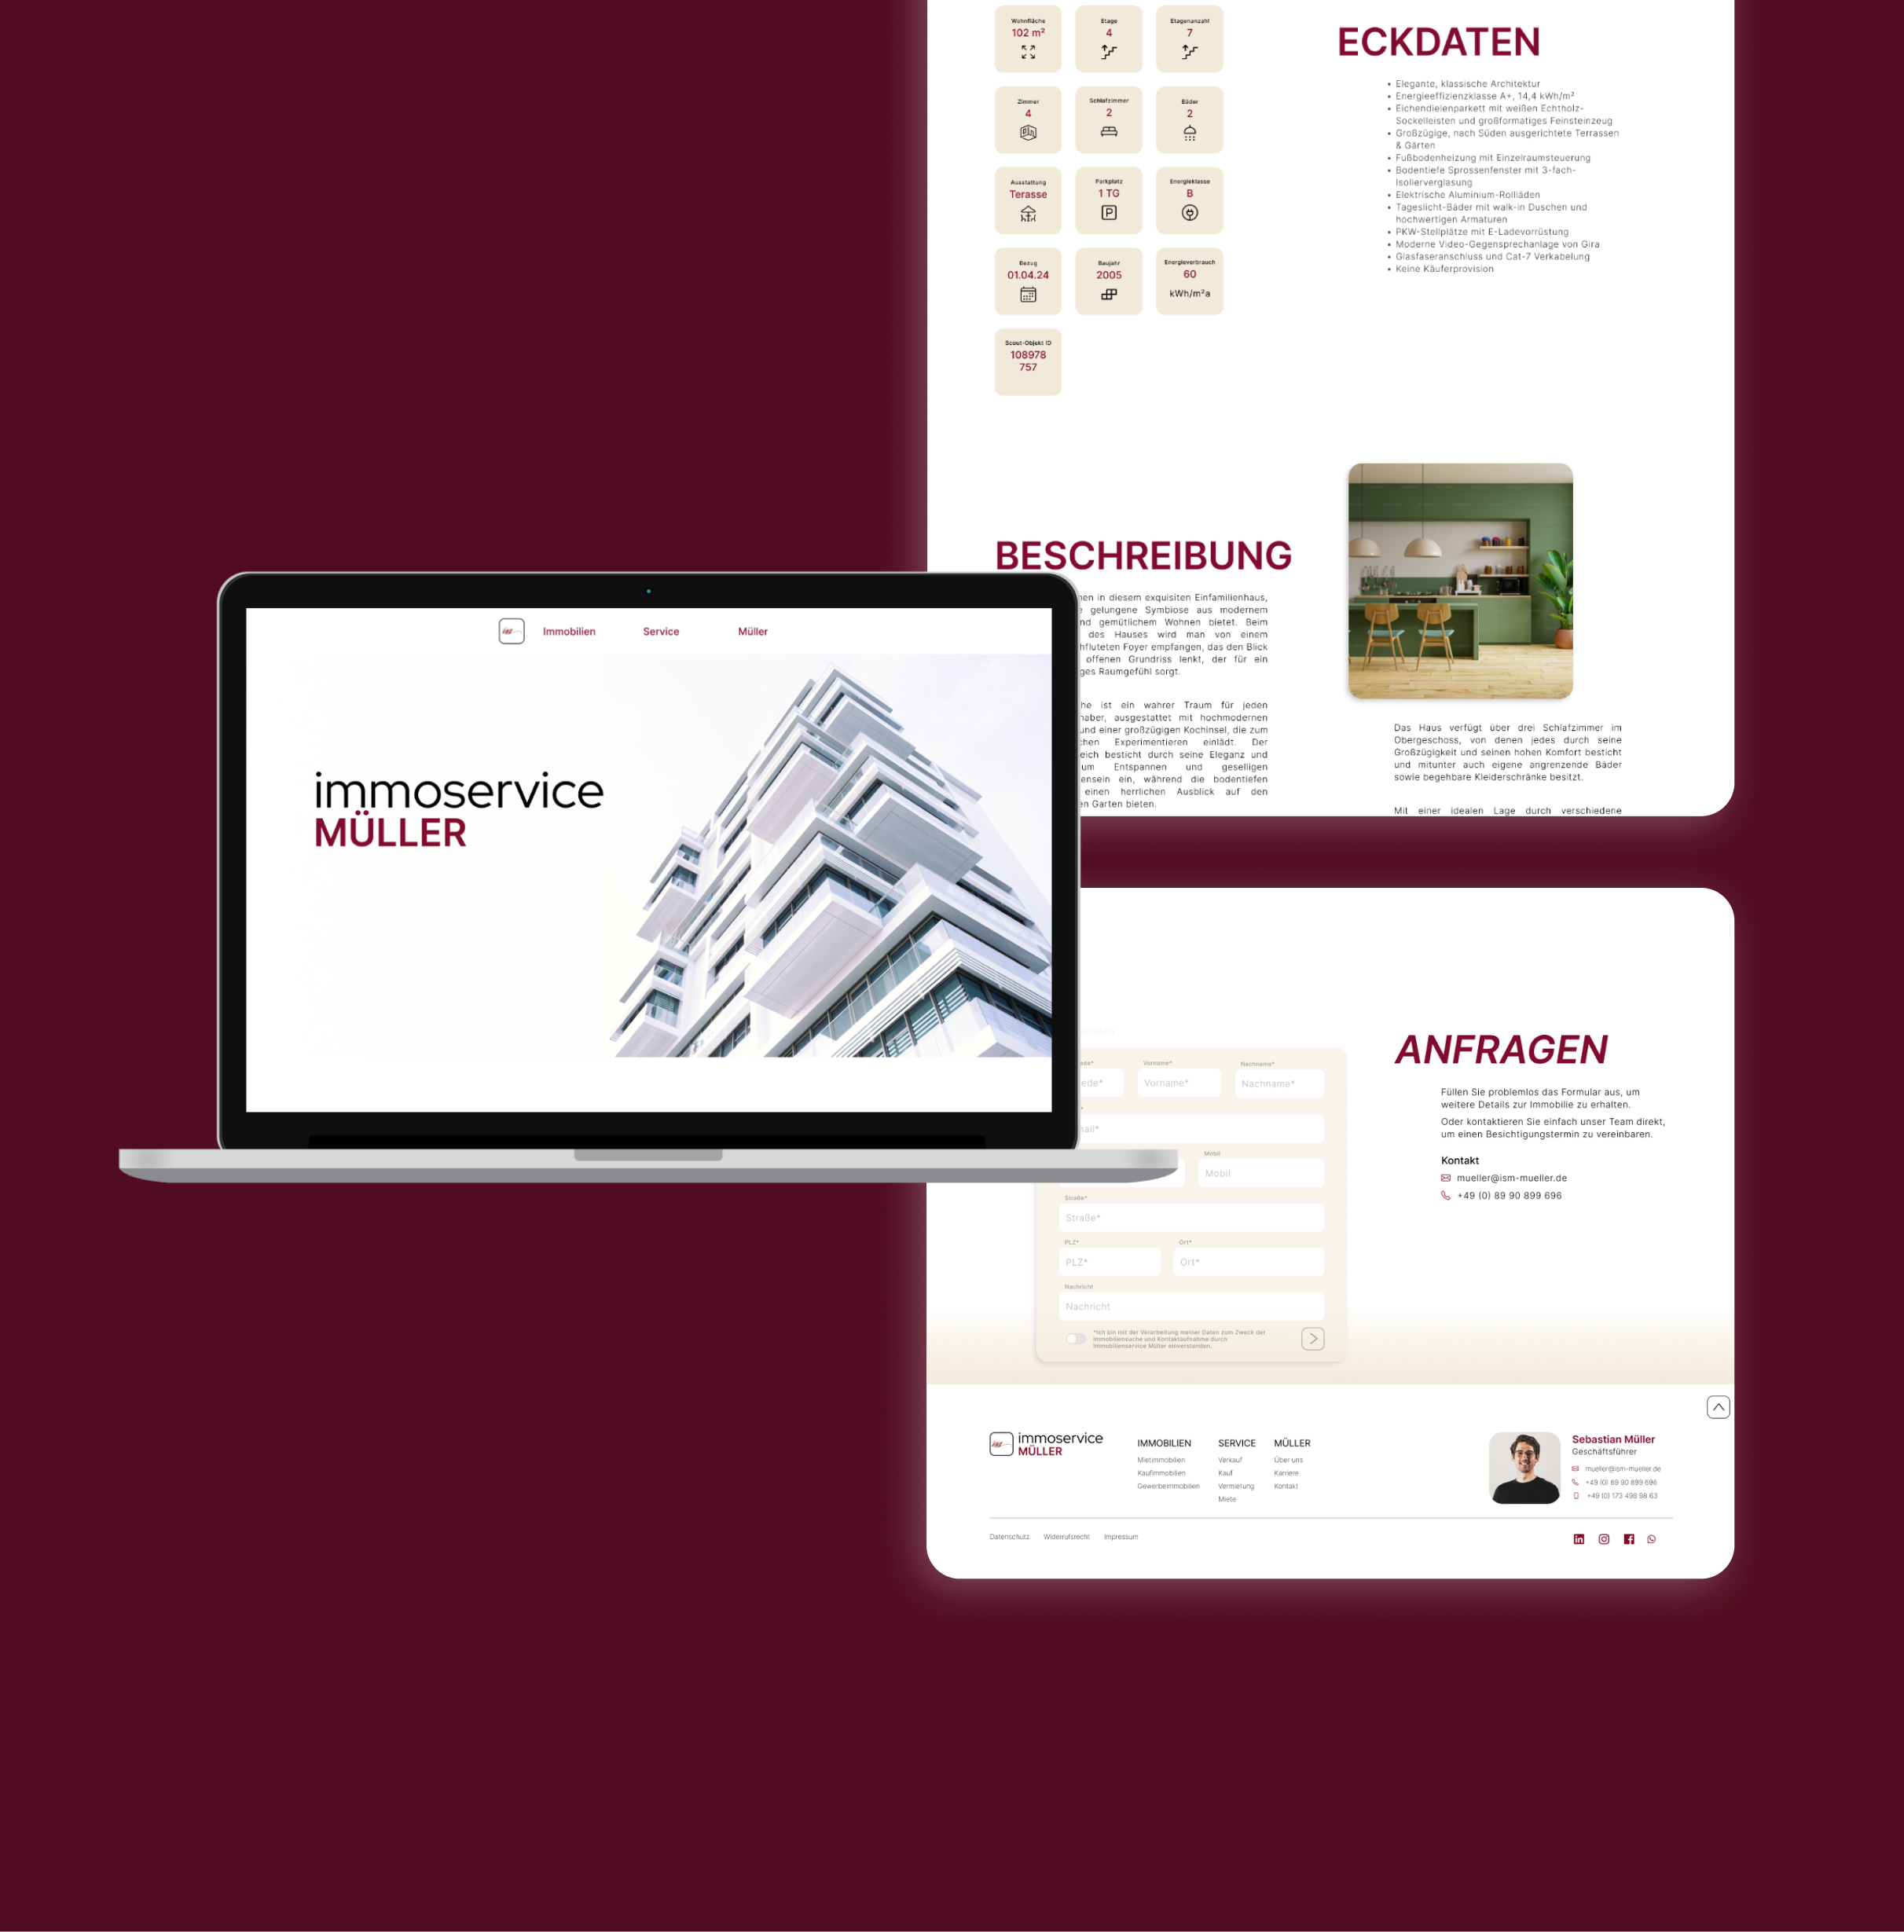
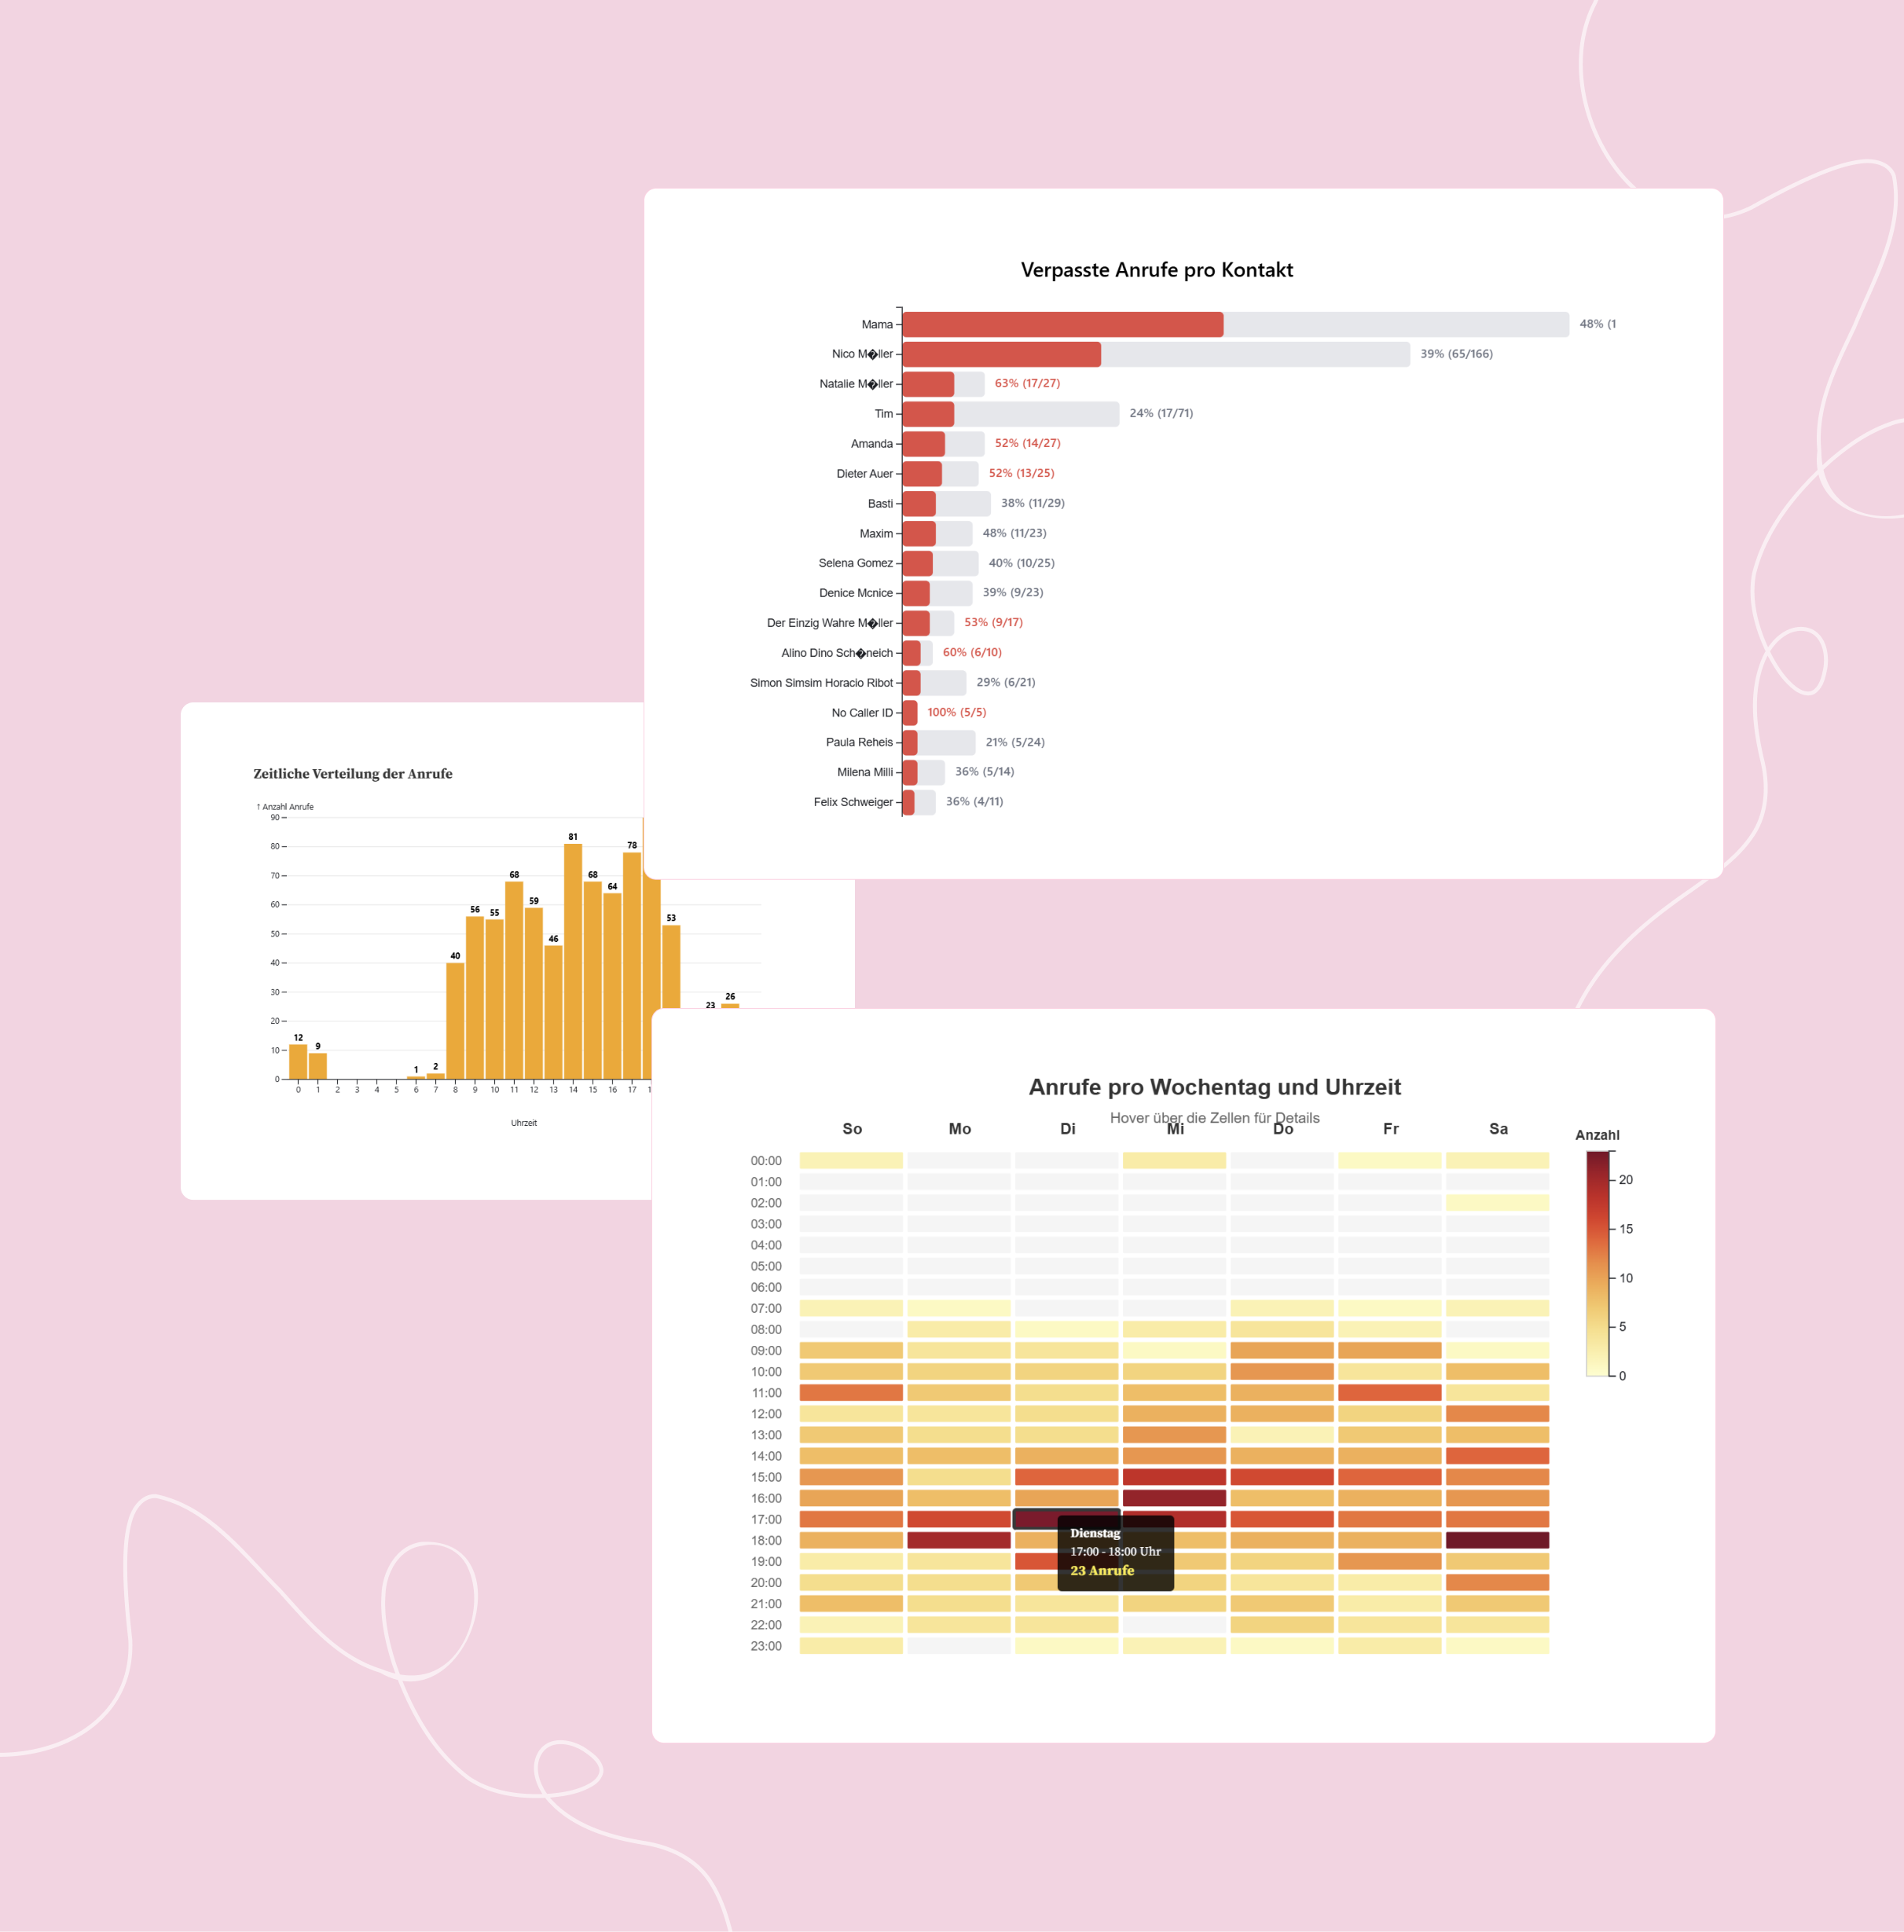
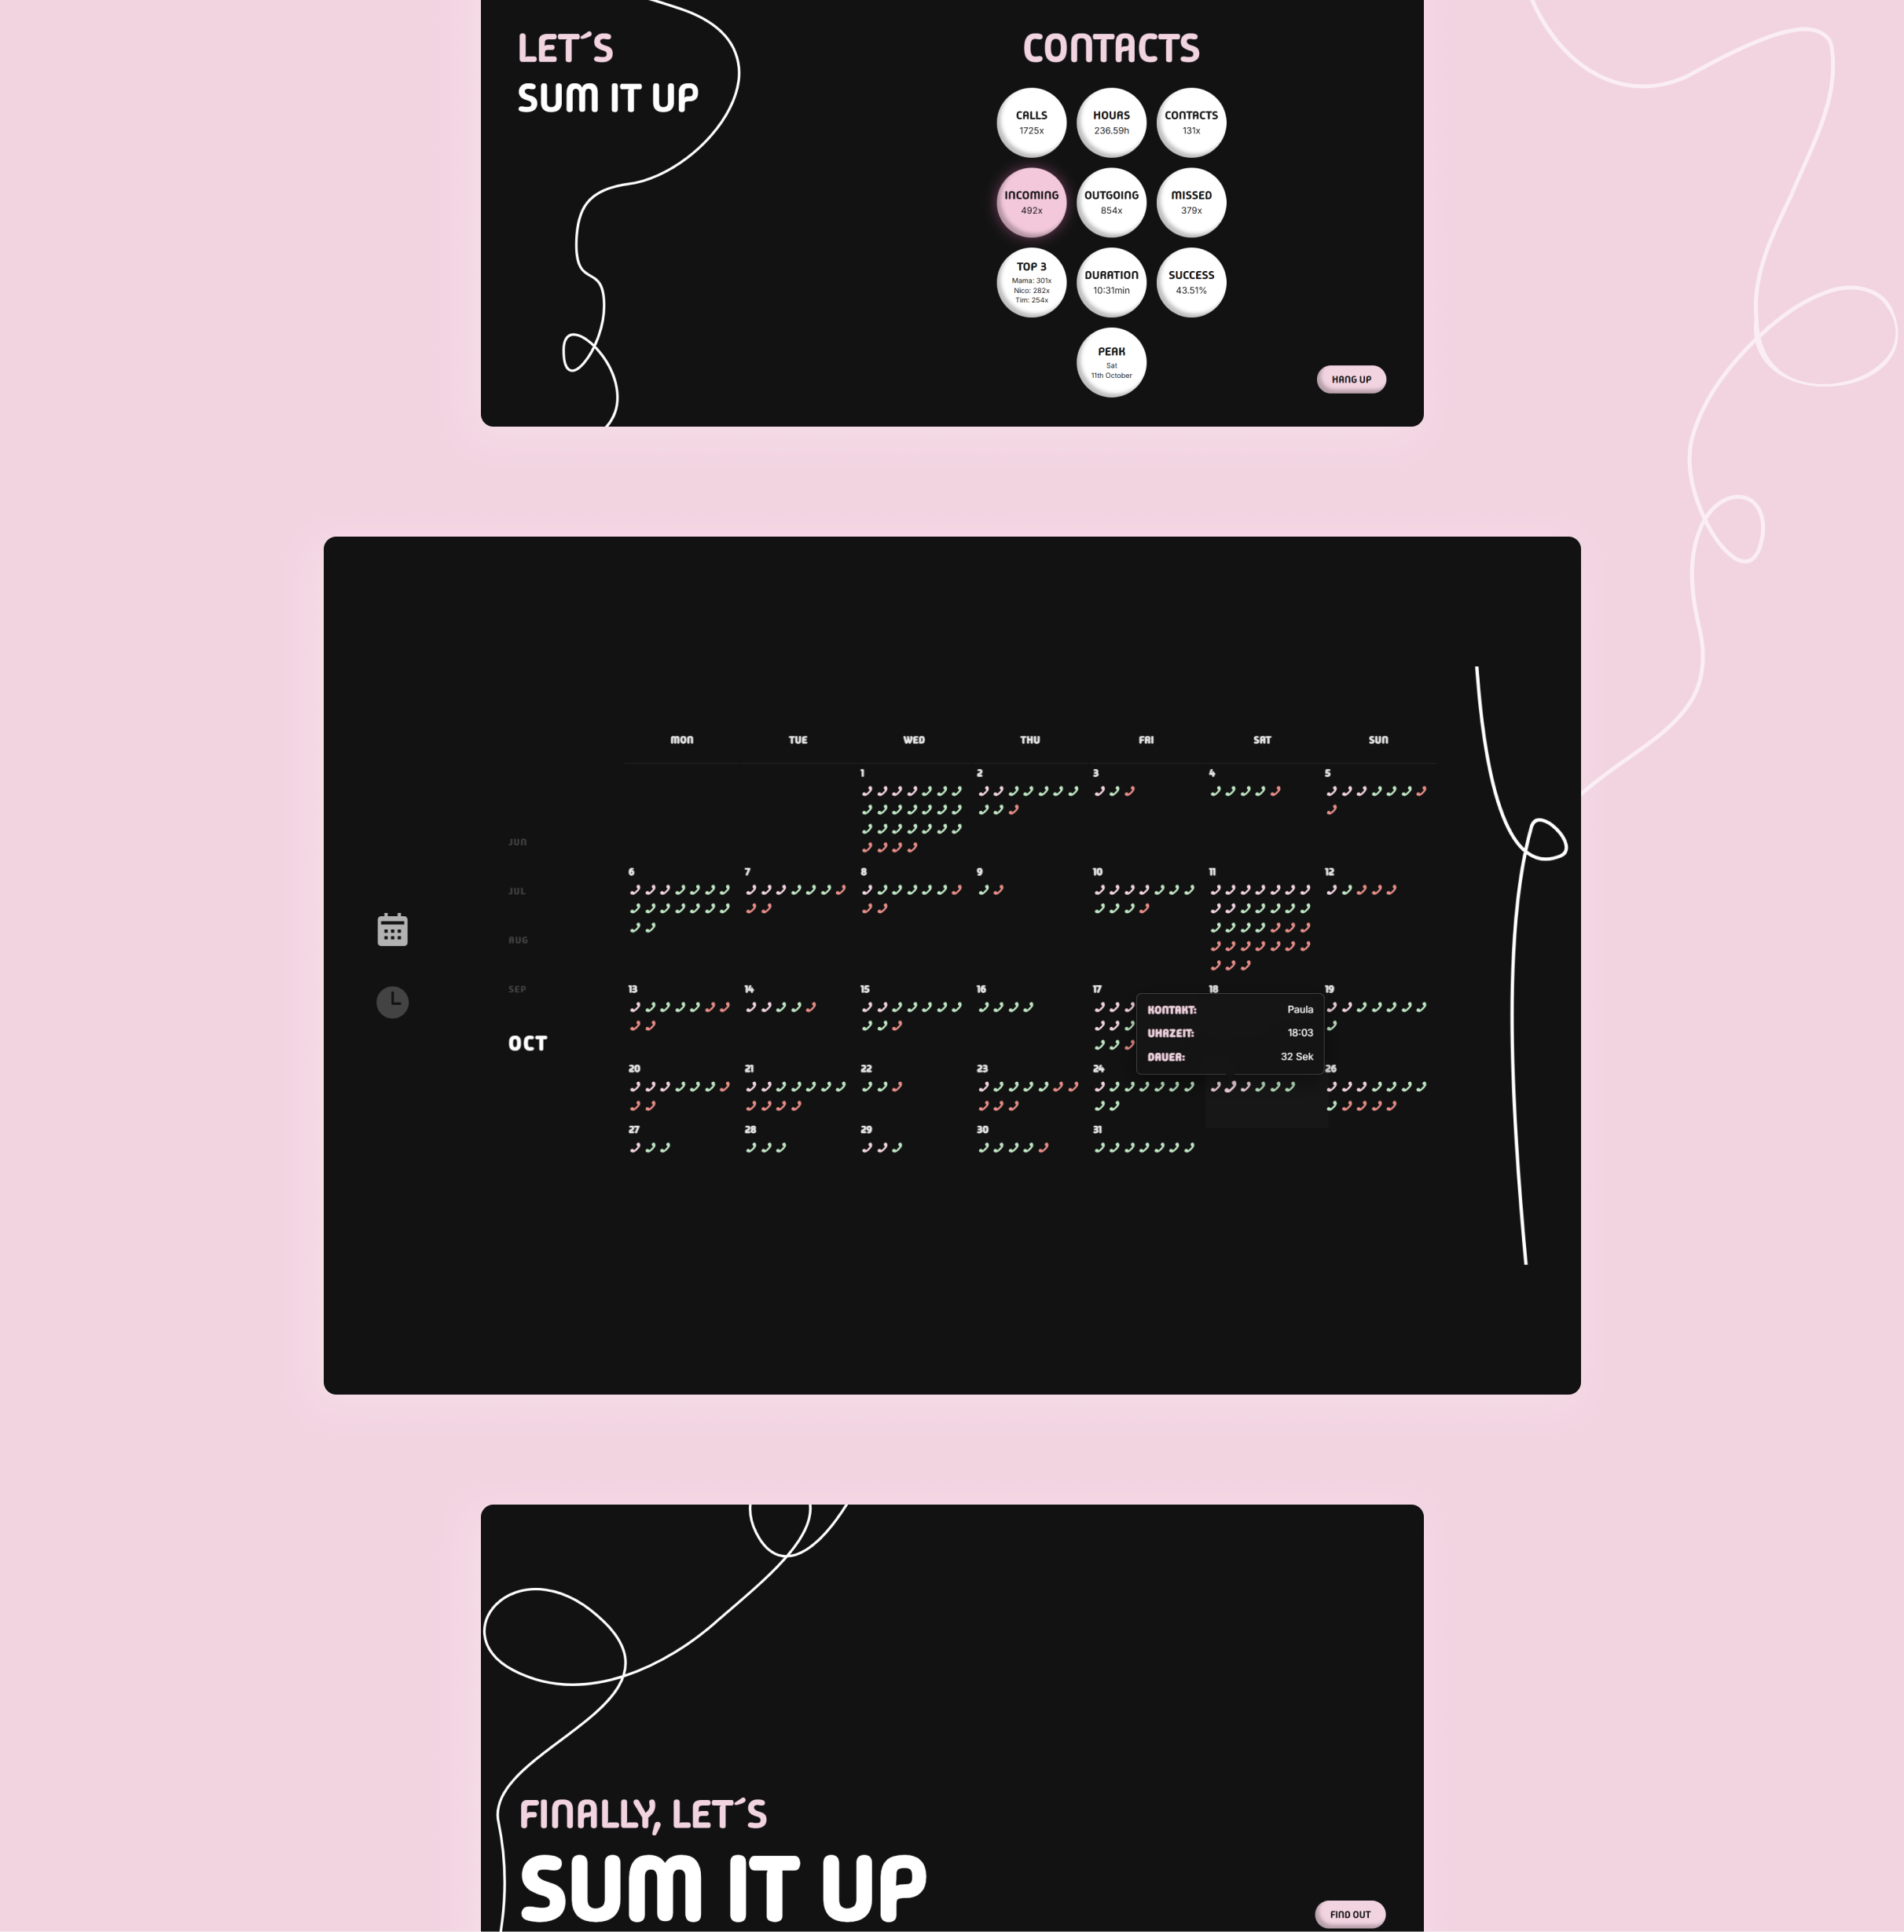
I gathered my outgoing call data from my provider and manually logged incoming and missed calls in an Excel file. By linking this information with my contacts, I was able to analyze patterns such as call duration and frequency, uncovering key insights to focus on.
approach
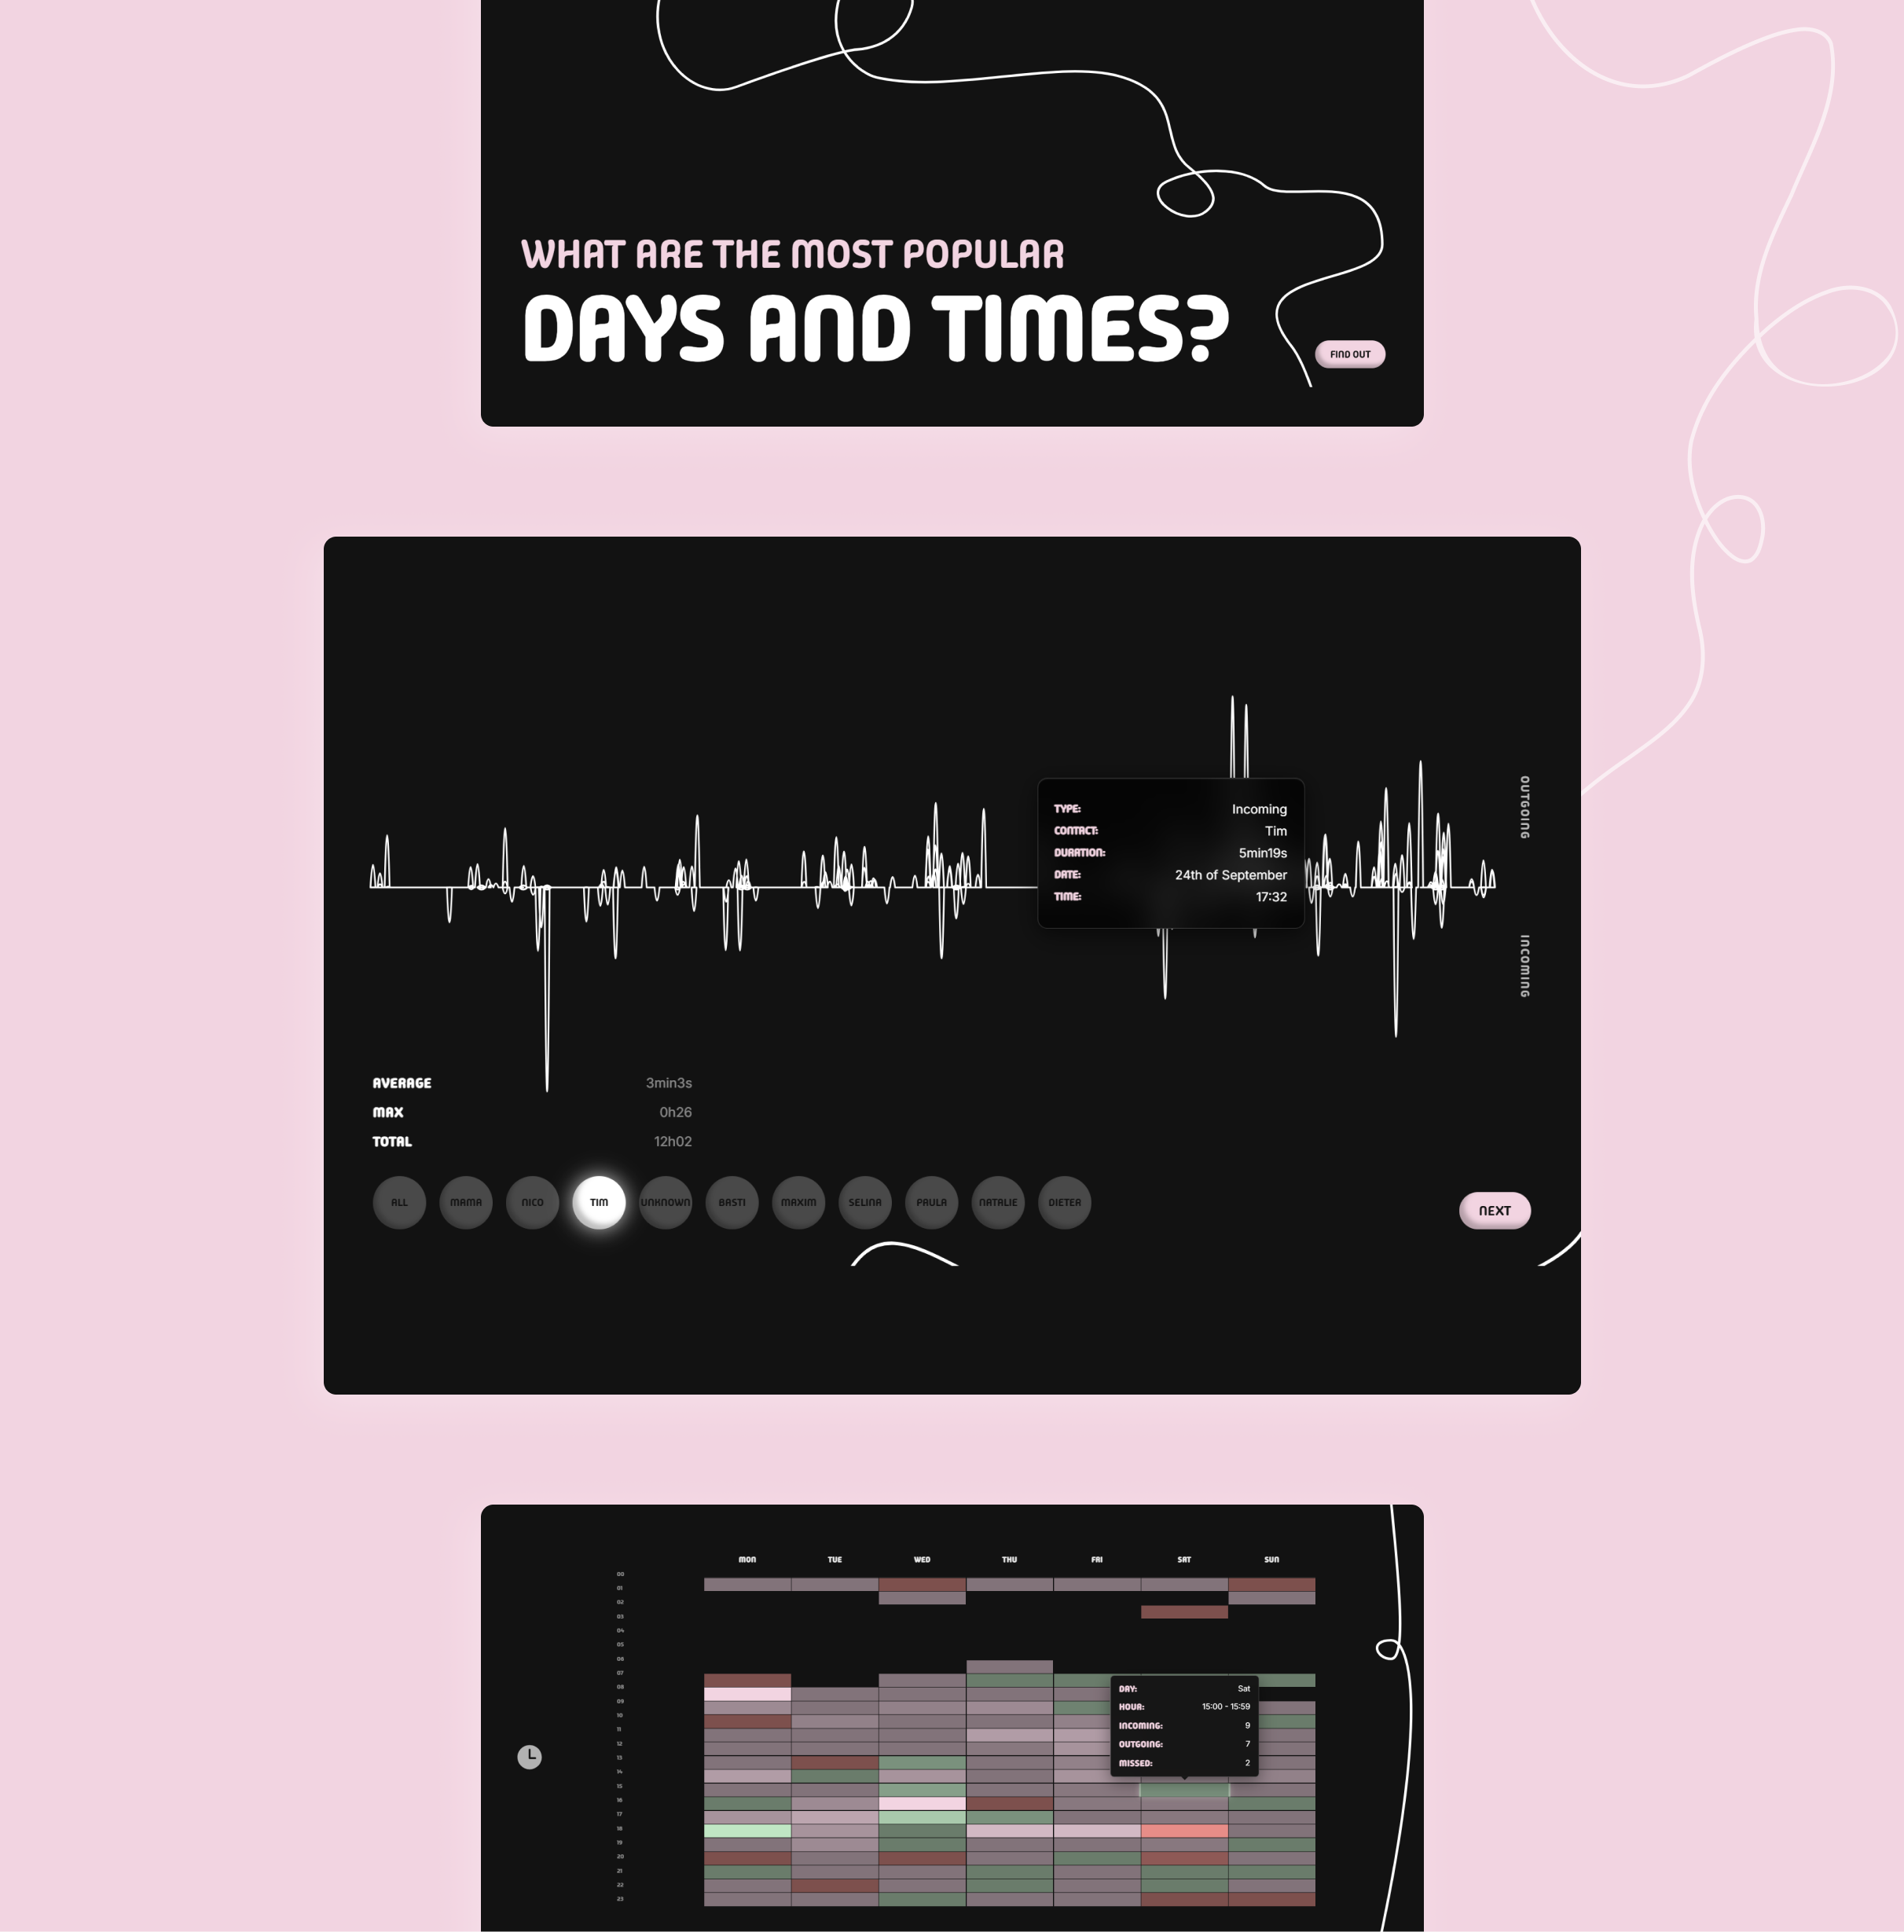
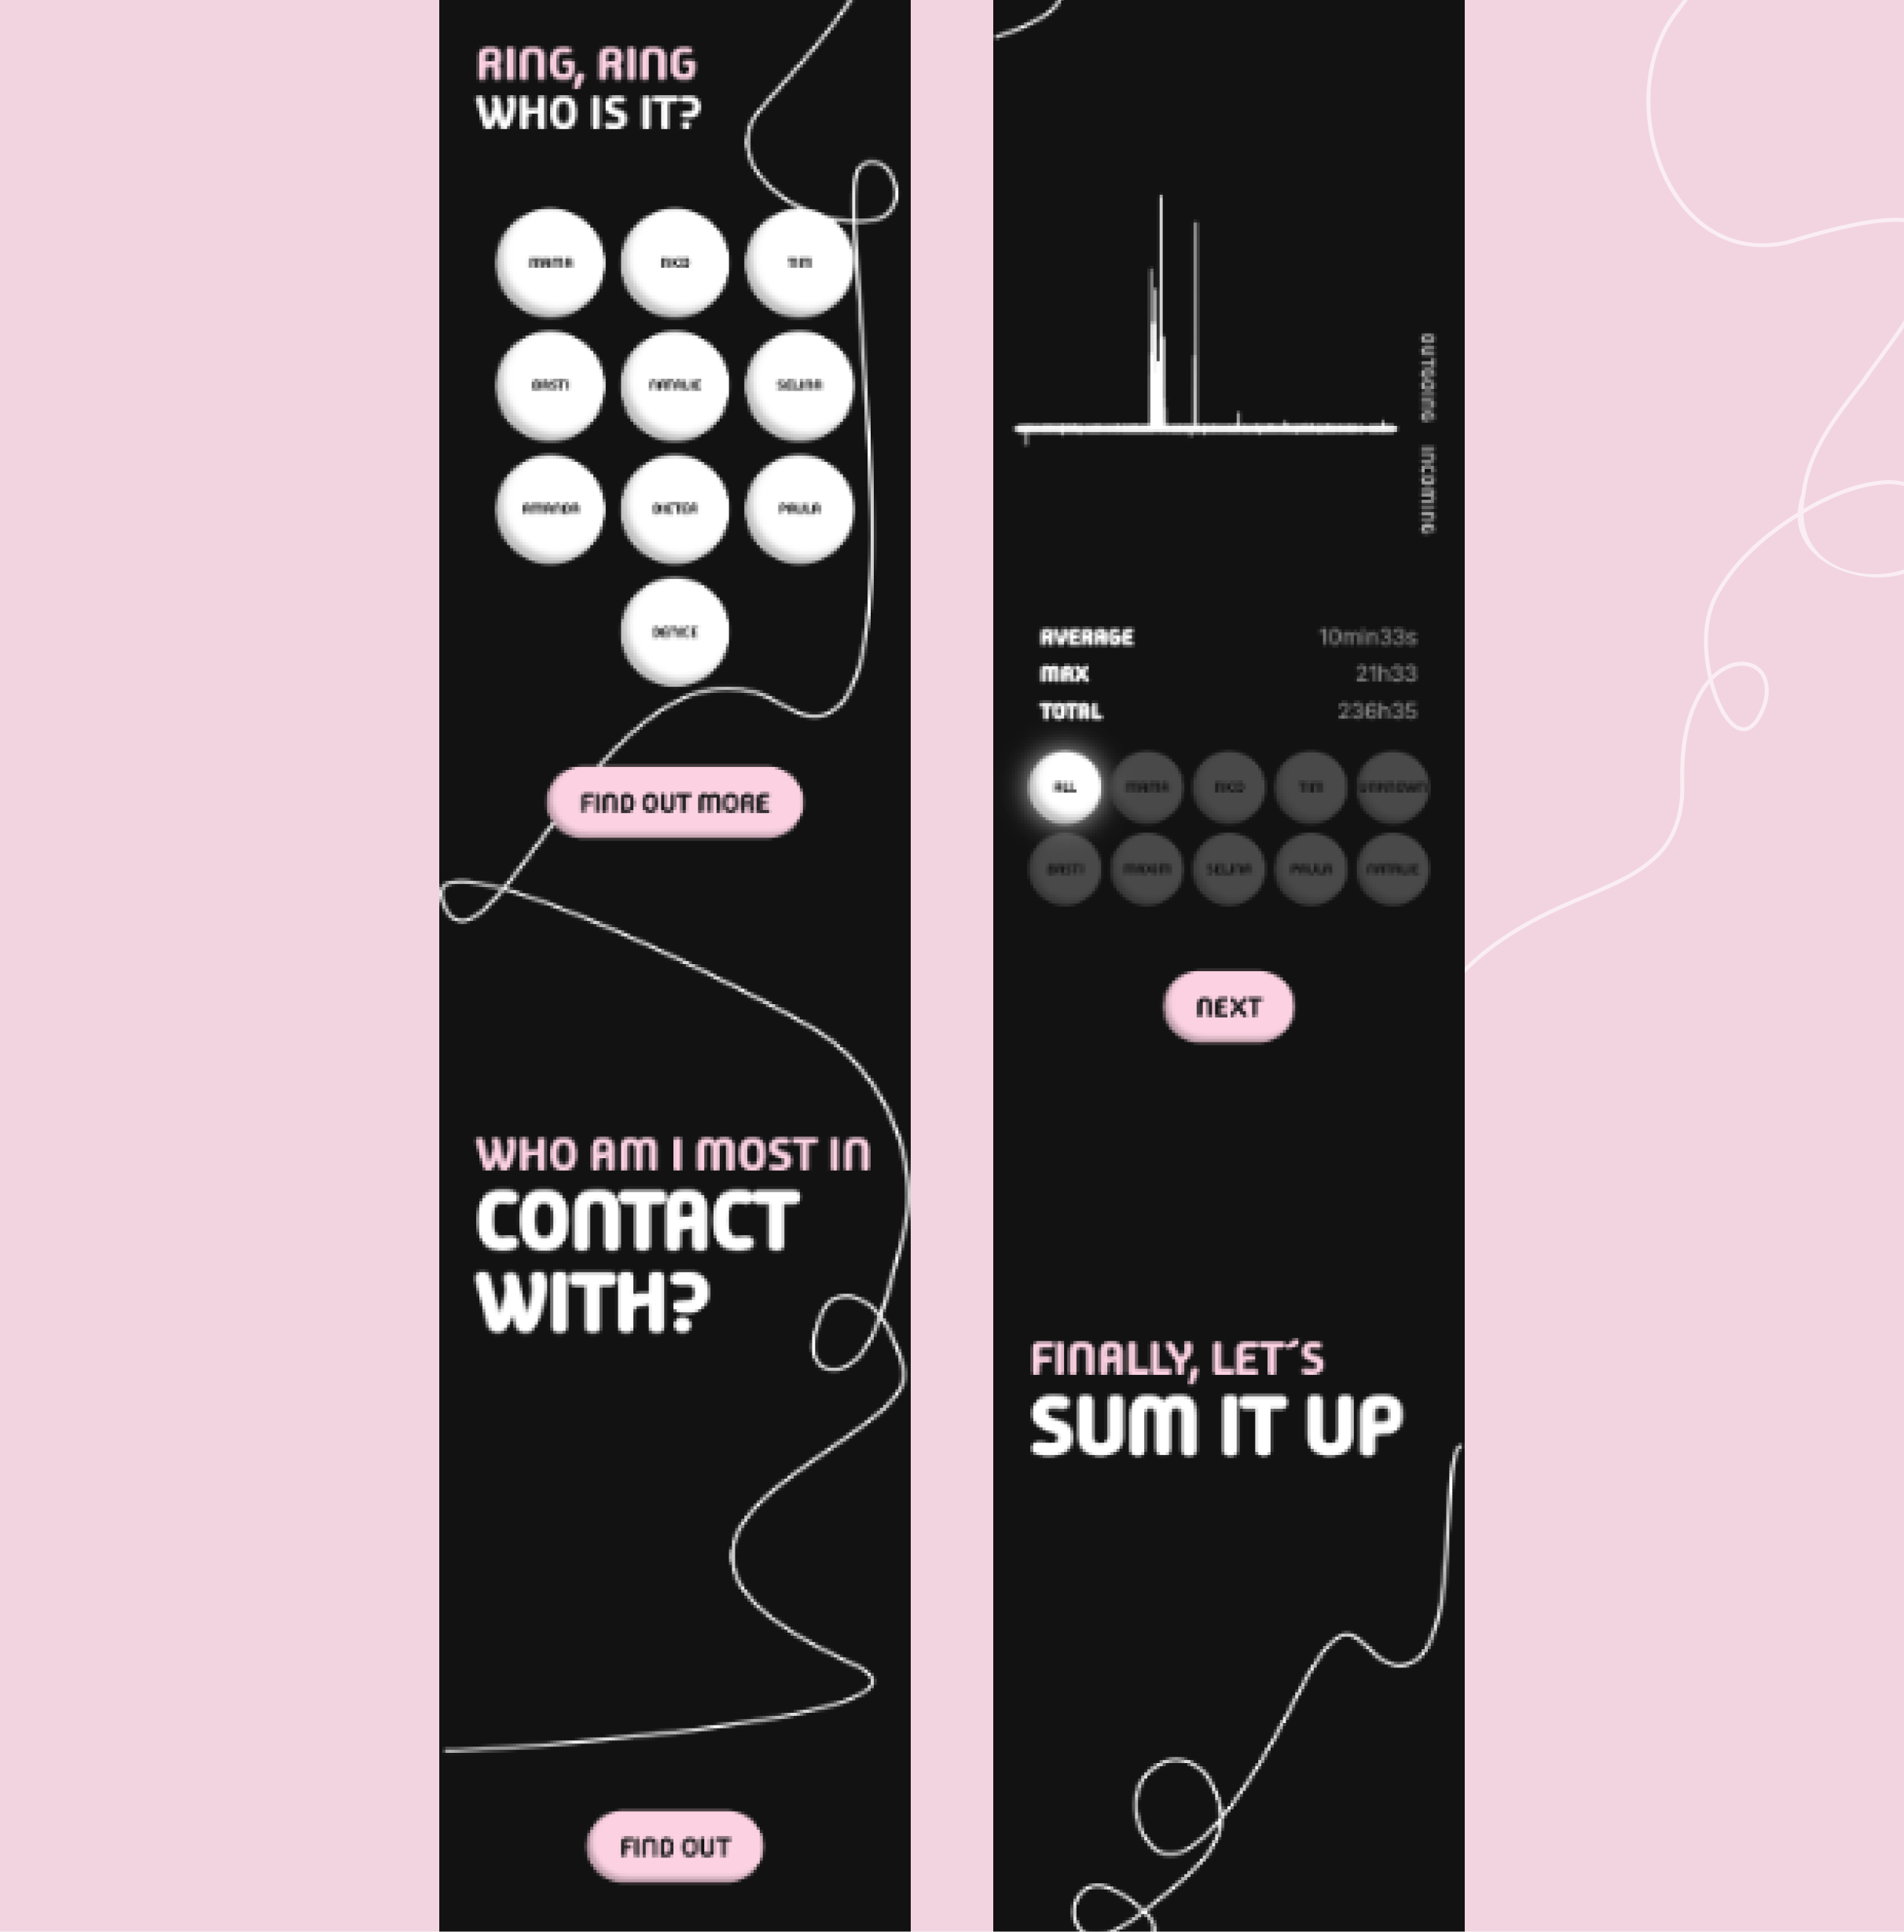
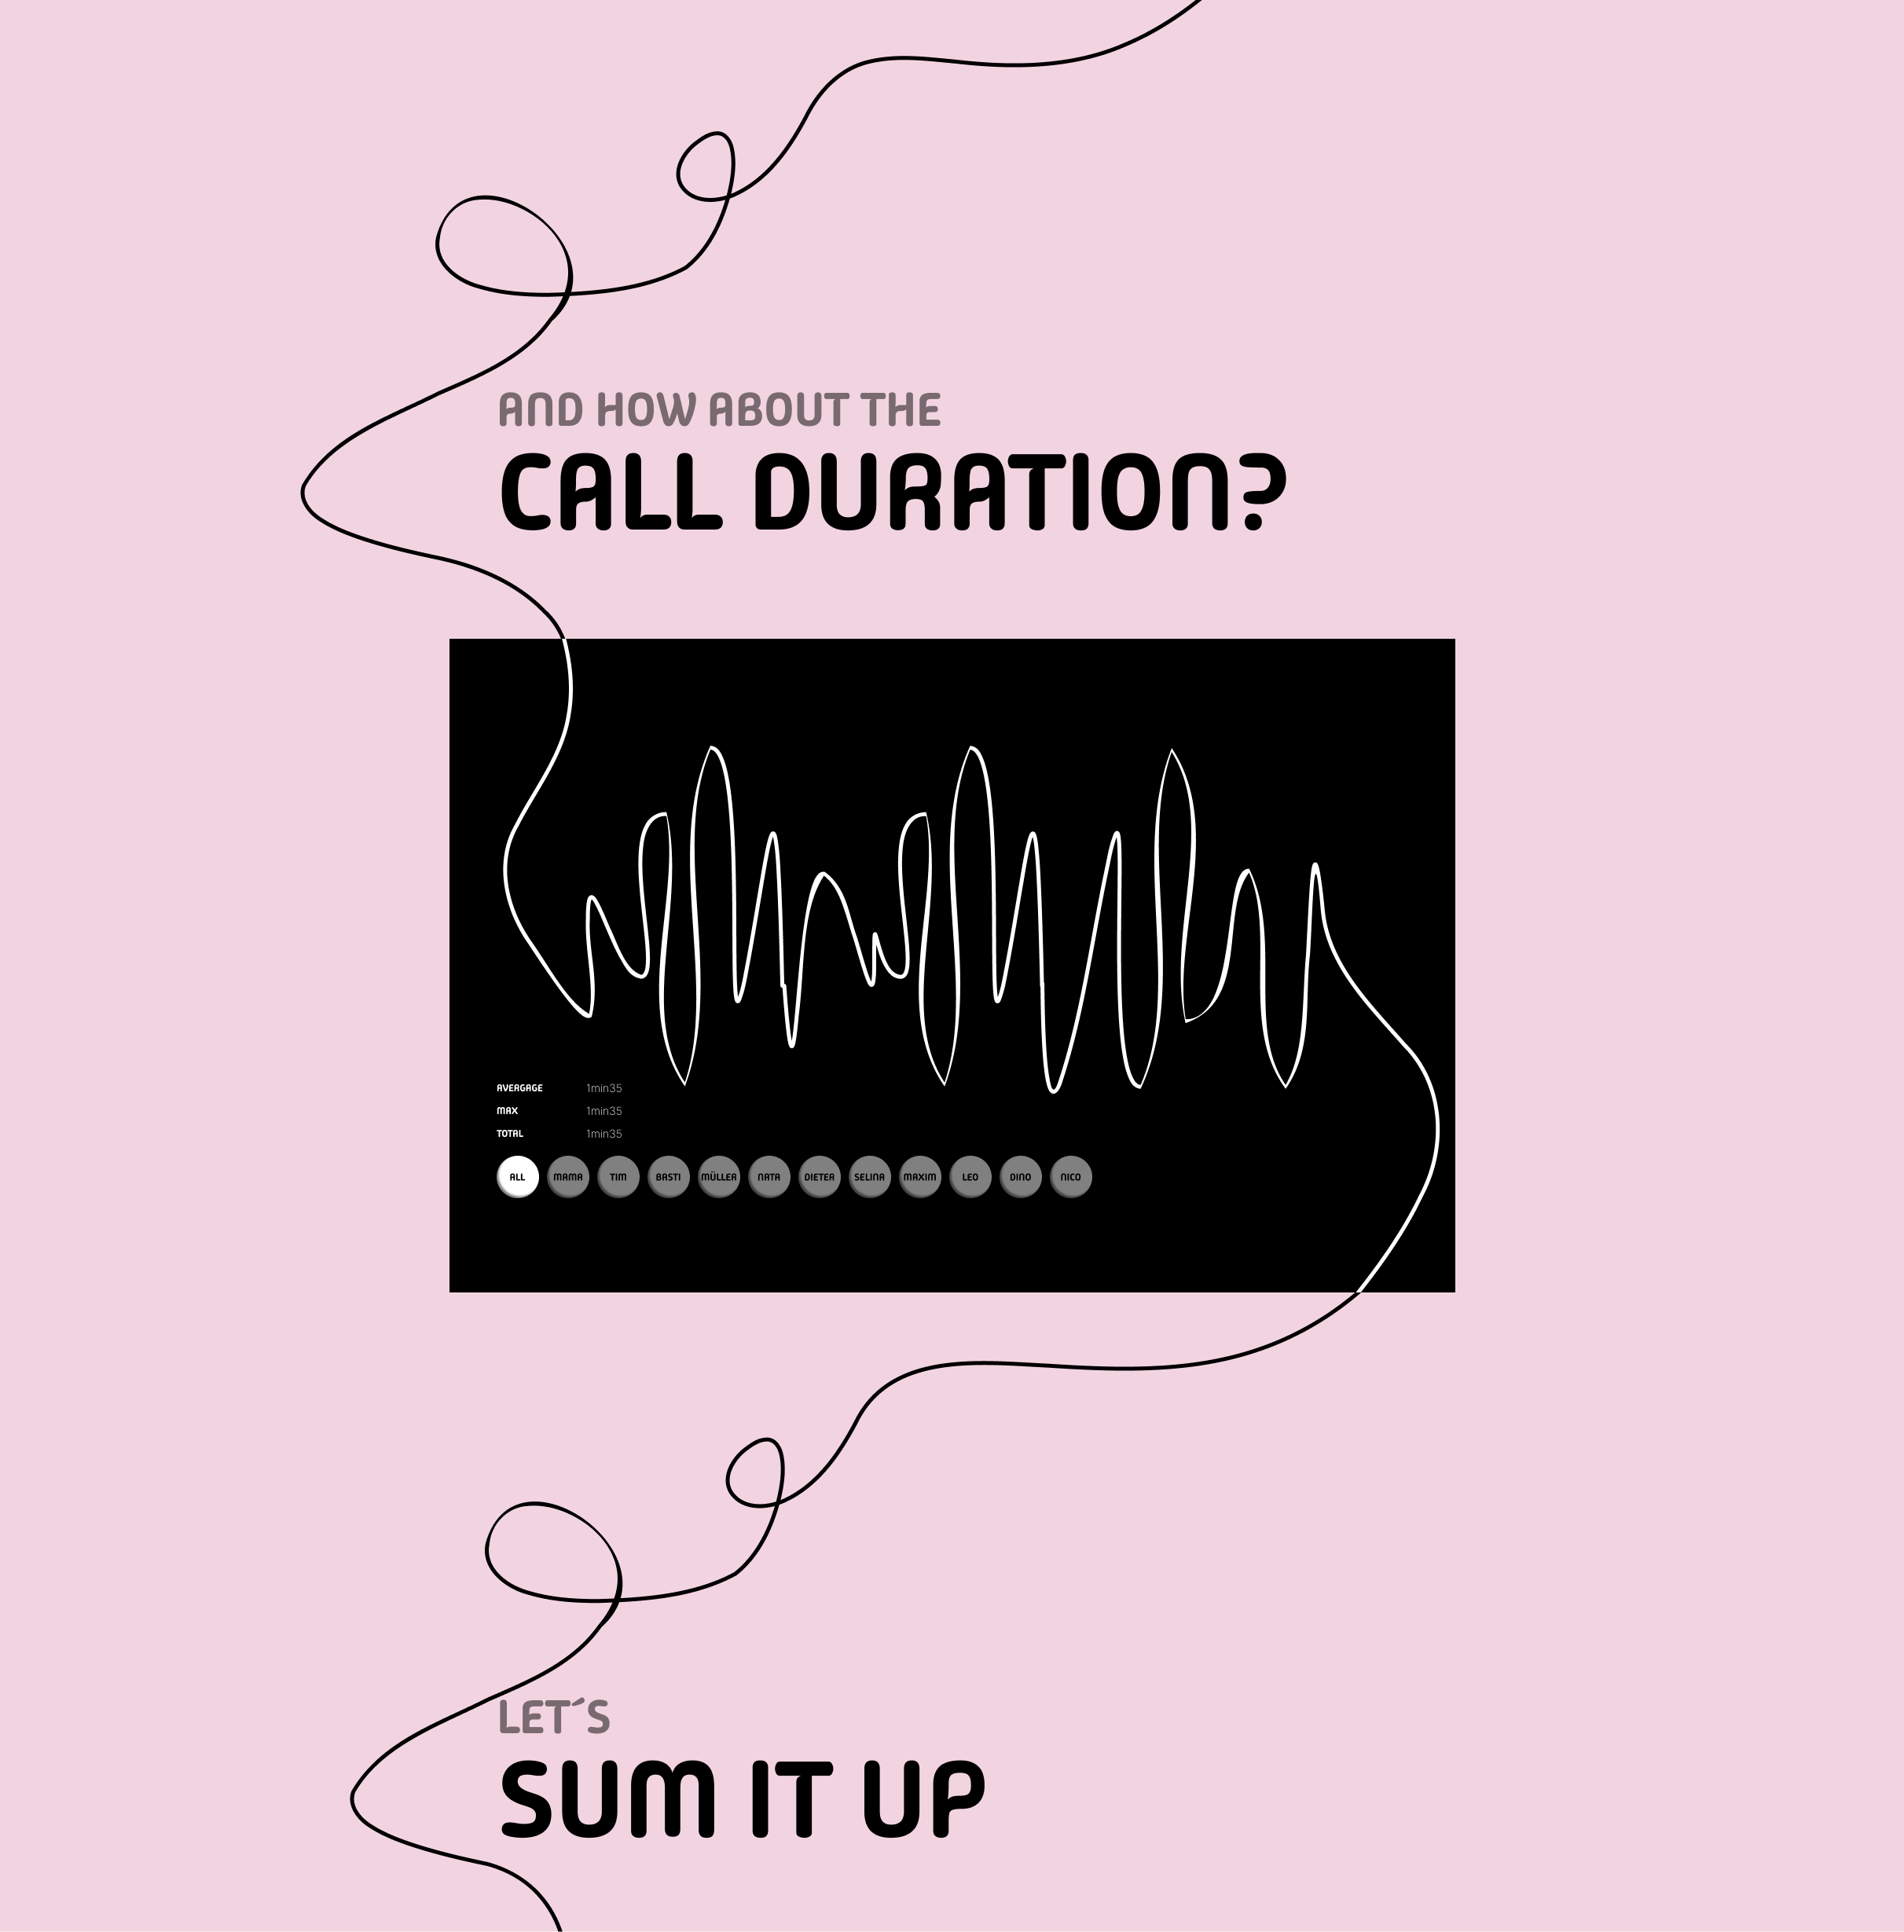
To create a playful yet structured design, I developed a design system and designed dedicated UI sections based on the key data topics, refining them iteratively throughout the process. For the responsive implementation, I created custom line illustrations and adapted them across four different screen sizes.
approach
Finally, I built the website using Svelte and brought it to life with GSAP animations, aiming to create a playful page with engaging transitions and effects. Despite the complexity of the animated data visualizations, I ensured smooth performance, responsive behavior, and fluid interactions across all screen sizes.
applied services
services
Development
UX/UI Design
Graphic Design
Data Visualization
result
result
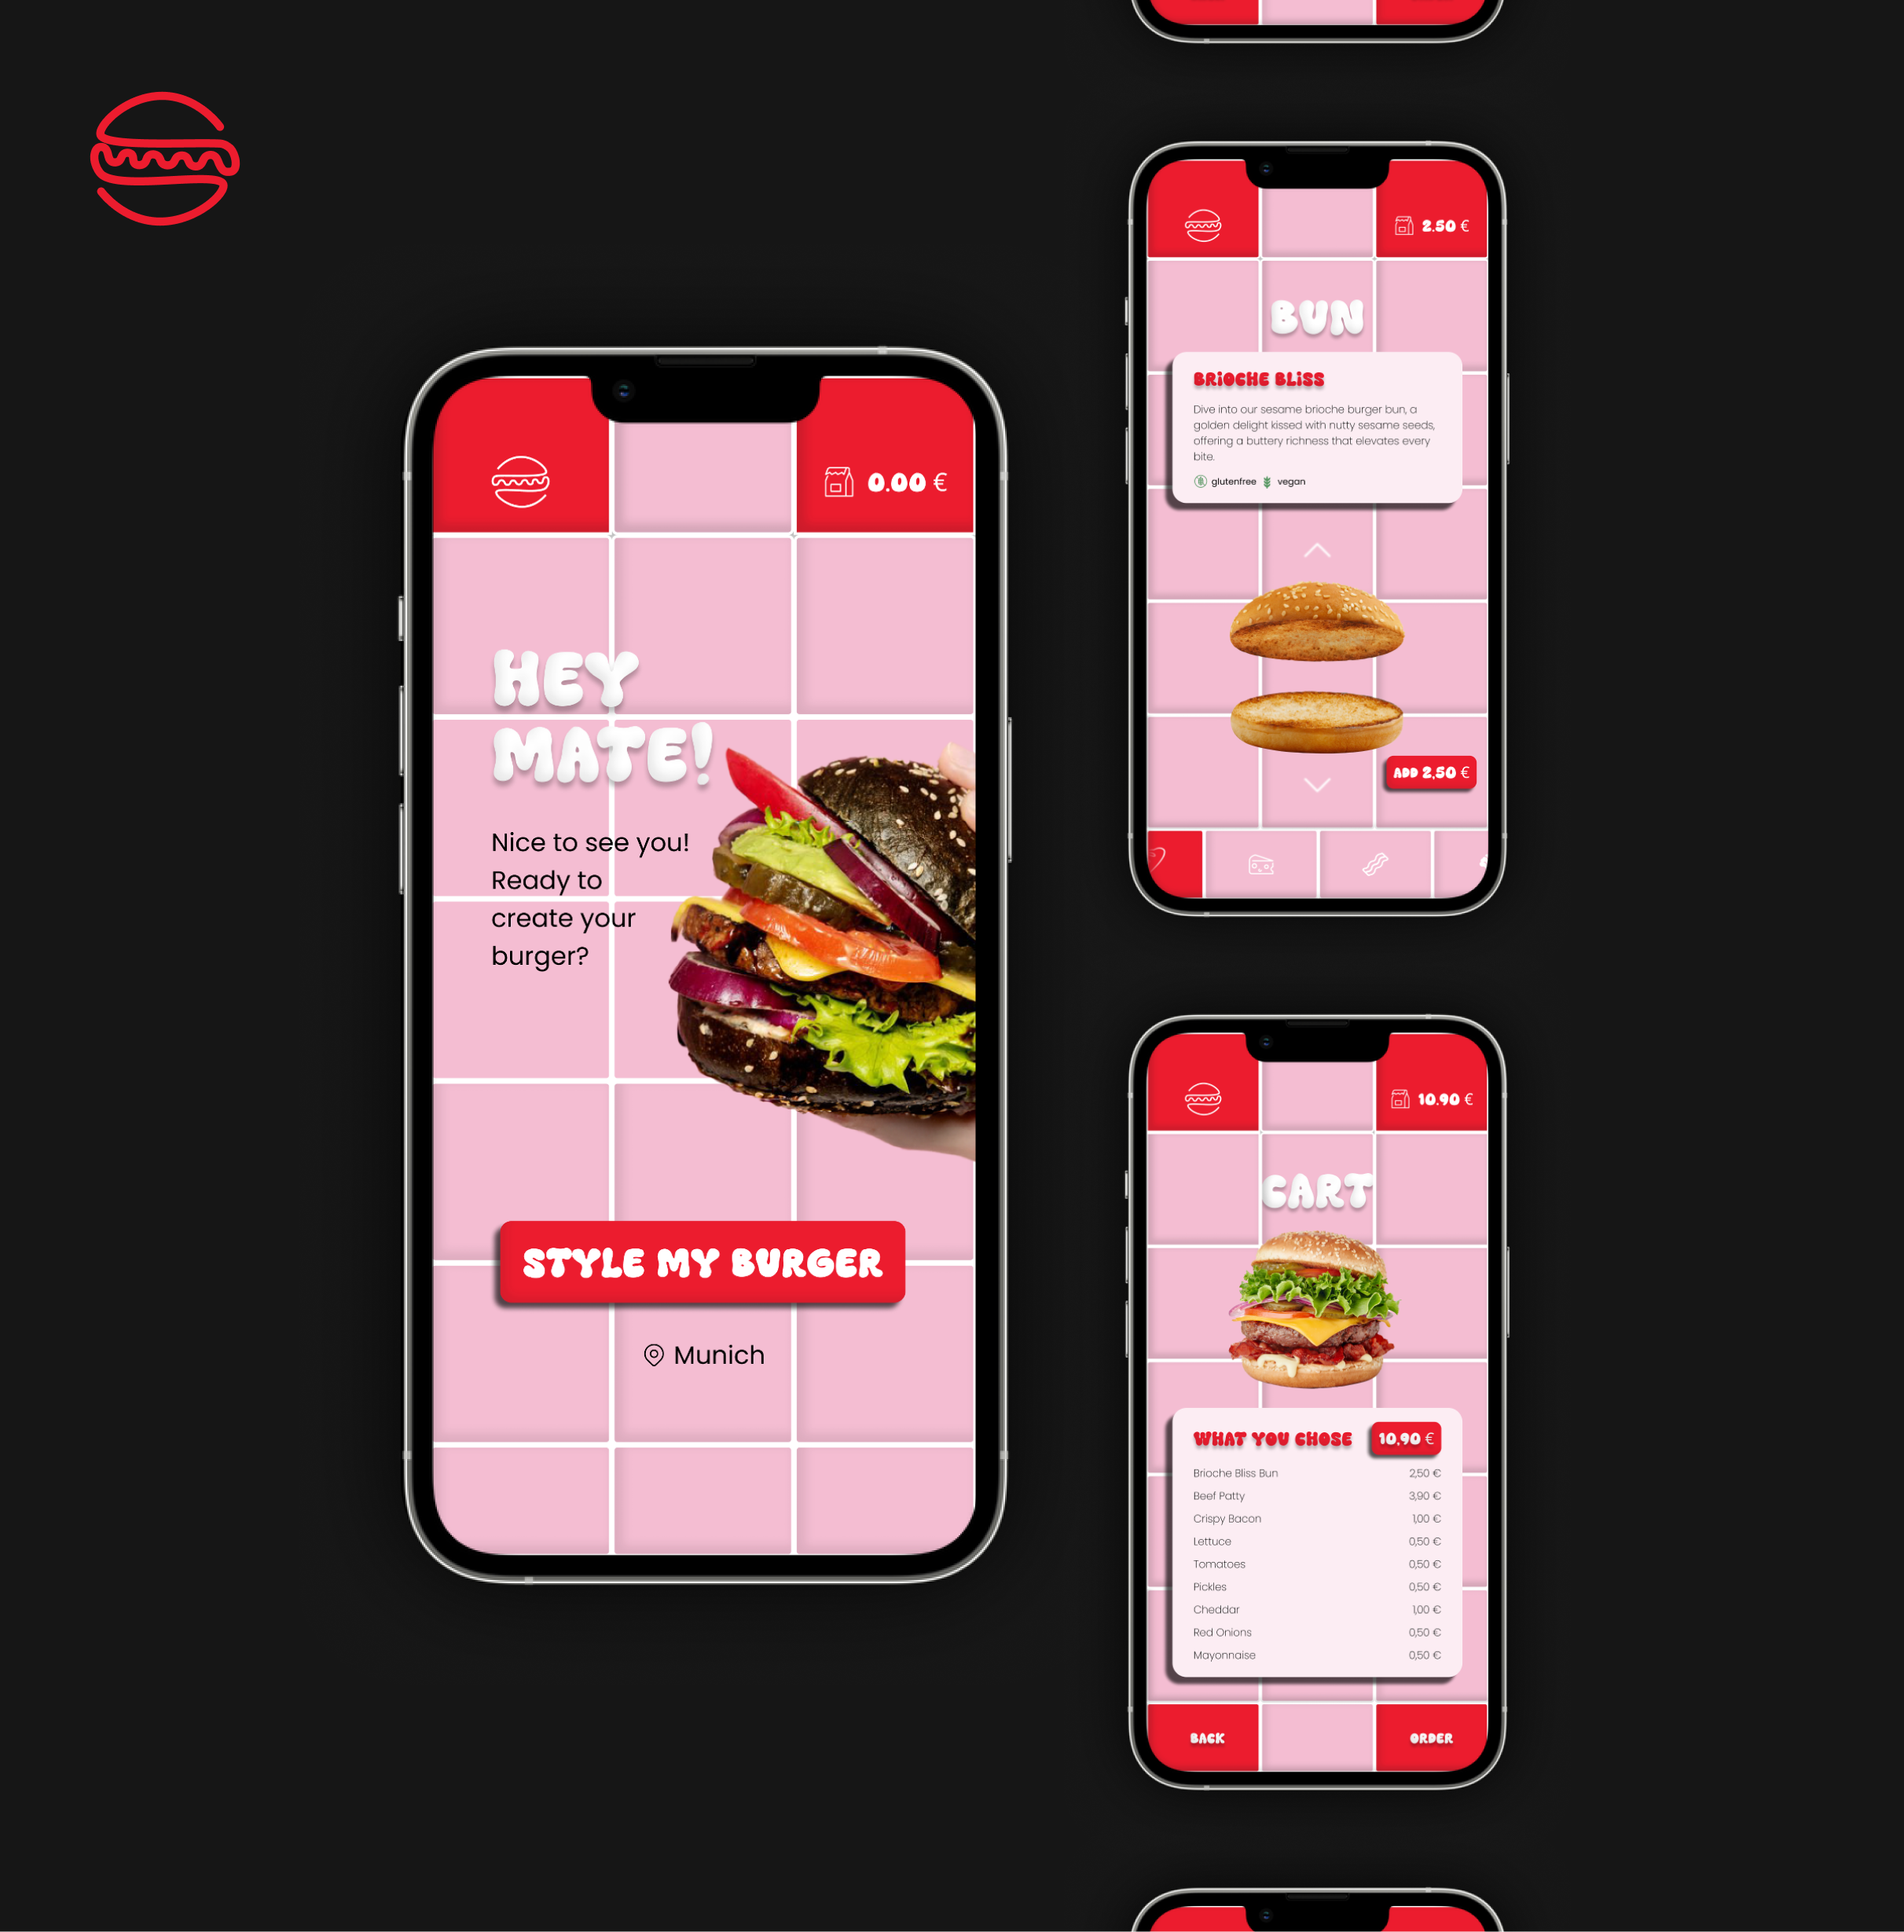
The final result is a playful, interactive experience where users start by ‘picking up’ the phone and end by ‘hanging up.’ In between, they can explore their call data through engaging animations and transitions, discovering insights in a fun and intuitive way. Once they reach the end, the interface loops back to the beginning, with the phone ringing again, creating a seamless and cyclical user journey.